Open Access
Fig. 1
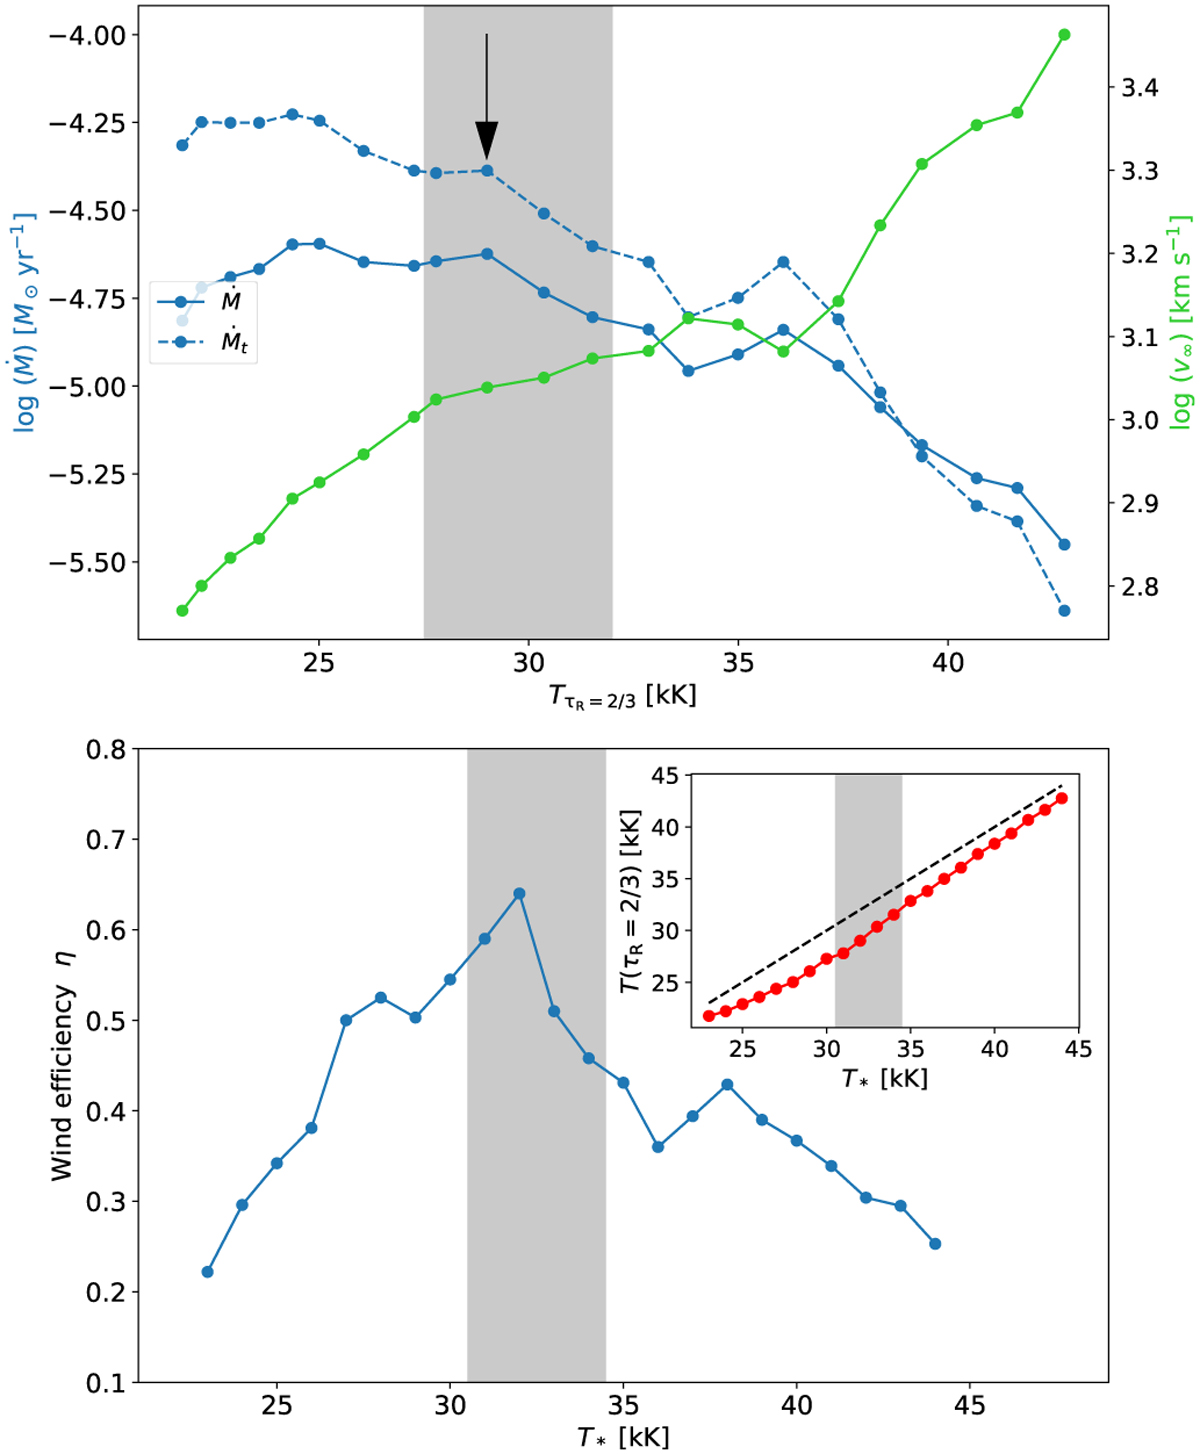
Download original image
Mass-loss rates Ṁ and Ṁt (top panel, dashed and solid blue lines, respectively), terminal velocities ν∞ (top panel, in green), and wind efficiency parameters η for the T* sequence of Z* = Z⊙ atmosphere models. The shaded region denotes the transition regions of two wind regimes. The arrow denotes the T* where η overturns.
Current usage metrics show cumulative count of Article Views (full-text article views including HTML views, PDF and ePub downloads, according to the available data) and Abstracts Views on Vision4Press platform.
Data correspond to usage on the plateform after 2015. The current usage metrics is available 48-96 hours after online publication and is updated daily on week days.
Initial download of the metrics may take a while.