Open Access
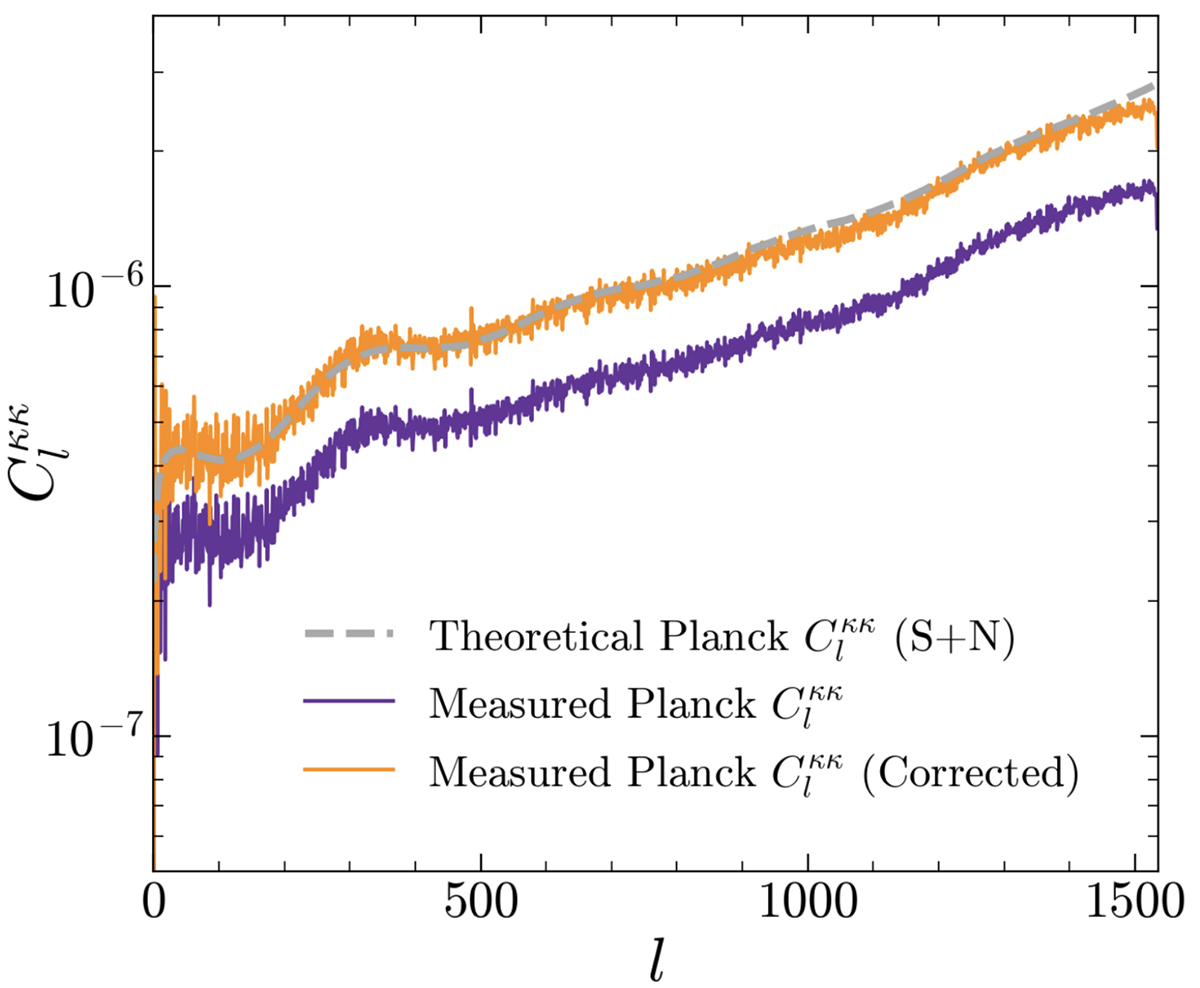
Fig. 9.
Download original image
Theoretical (dashed gray line) and observed angular power spectra, shown before (purple line) and after (orange line) the linear correction for the mask effect. The theoretical prediction is derived from the best-fit cosmology of the Planck 2018 results.
Current usage metrics show cumulative count of Article Views (full-text article views including HTML views, PDF and ePub downloads, according to the available data) and Abstracts Views on Vision4Press platform.
Data correspond to usage on the plateform after 2015. The current usage metrics is available 48-96 hours after online publication and is updated daily on week days.
Initial download of the metrics may take a while.