Fig. 7.
Download original image
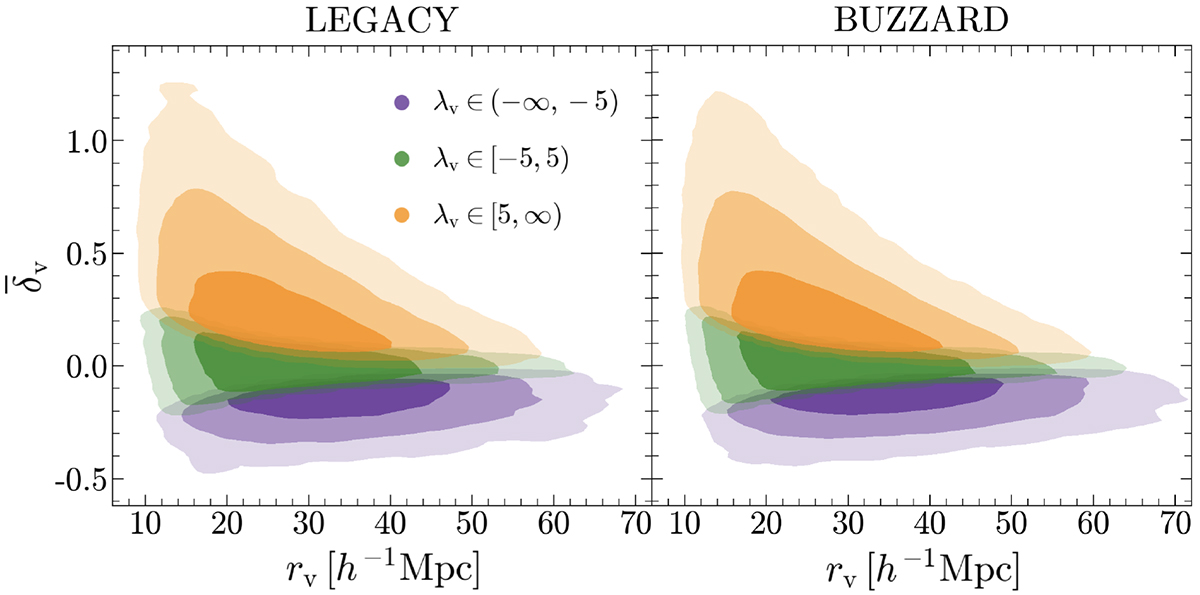
Contours in the ![]() space for the full observed (left) and simulated (right) void samples. The voids are divided into three populations according to their λv values, following the binning strategy described in Sect. 3.2.2. It can be seen that the λv subdivision is primarily driven by the
space for the full observed (left) and simulated (right) void samples. The voids are divided into three populations according to their λv values, following the binning strategy described in Sect. 3.2.2. It can be seen that the λv subdivision is primarily driven by the ![]() values: voids with λv ∈ (5, ∞) (orange) exhibit positive
values: voids with λv ∈ (5, ∞) (orange) exhibit positive ![]() values, voids with λv ∈ ( − ∞, −5] (purple) show negative
values, voids with λv ∈ ( − ∞, −5] (purple) show negative ![]() , and voids in the range λv ∈ ( − 5, 5] (green) tend to have
, and voids in the range λv ∈ ( − 5, 5] (green) tend to have ![]() , forming a transition zone between the two populations. Negative-λv voids are also more likely to have larger rv values compared to positive-λv voids.
, forming a transition zone between the two populations. Negative-λv voids are also more likely to have larger rv values compared to positive-λv voids.
Current usage metrics show cumulative count of Article Views (full-text article views including HTML views, PDF and ePub downloads, according to the available data) and Abstracts Views on Vision4Press platform.
Data correspond to usage on the plateform after 2015. The current usage metrics is available 48-96 hours after online publication and is updated daily on week days.
Initial download of the metrics may take a while.