Fig. 5.

Download original image
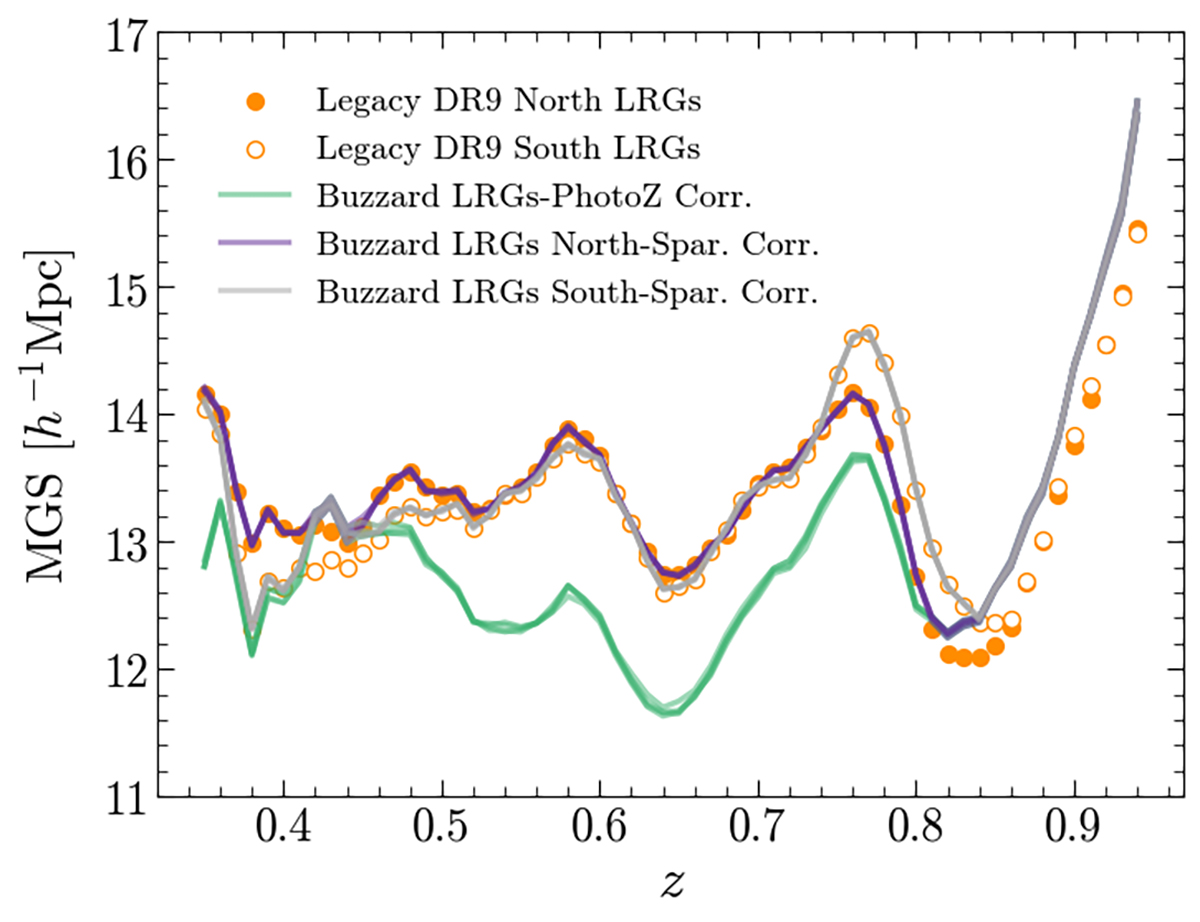
Redshift evolution of the MGS observed in the Legacy Survey, measured in the North (orange dots) and South (white dots) regions. The observed MGS values are compared with those from the four redshift-calibrated Buzzard mock realizations before (purple lines) and then after sparseness correction, performed independently to match the North (green lines) and South (gray lines) regions. An almost complete match is observed between the observations and simulations, with only minor differences at z ∼ 0.4 and z > 0.8, where the mocks appear more sparse than the observations, making subsampling infeasible.
Current usage metrics show cumulative count of Article Views (full-text article views including HTML views, PDF and ePub downloads, according to the available data) and Abstracts Views on Vision4Press platform.
Data correspond to usage on the plateform after 2015. The current usage metrics is available 48-96 hours after online publication and is updated daily on week days.
Initial download of the metrics may take a while.


