Fig. 3.
Download original image
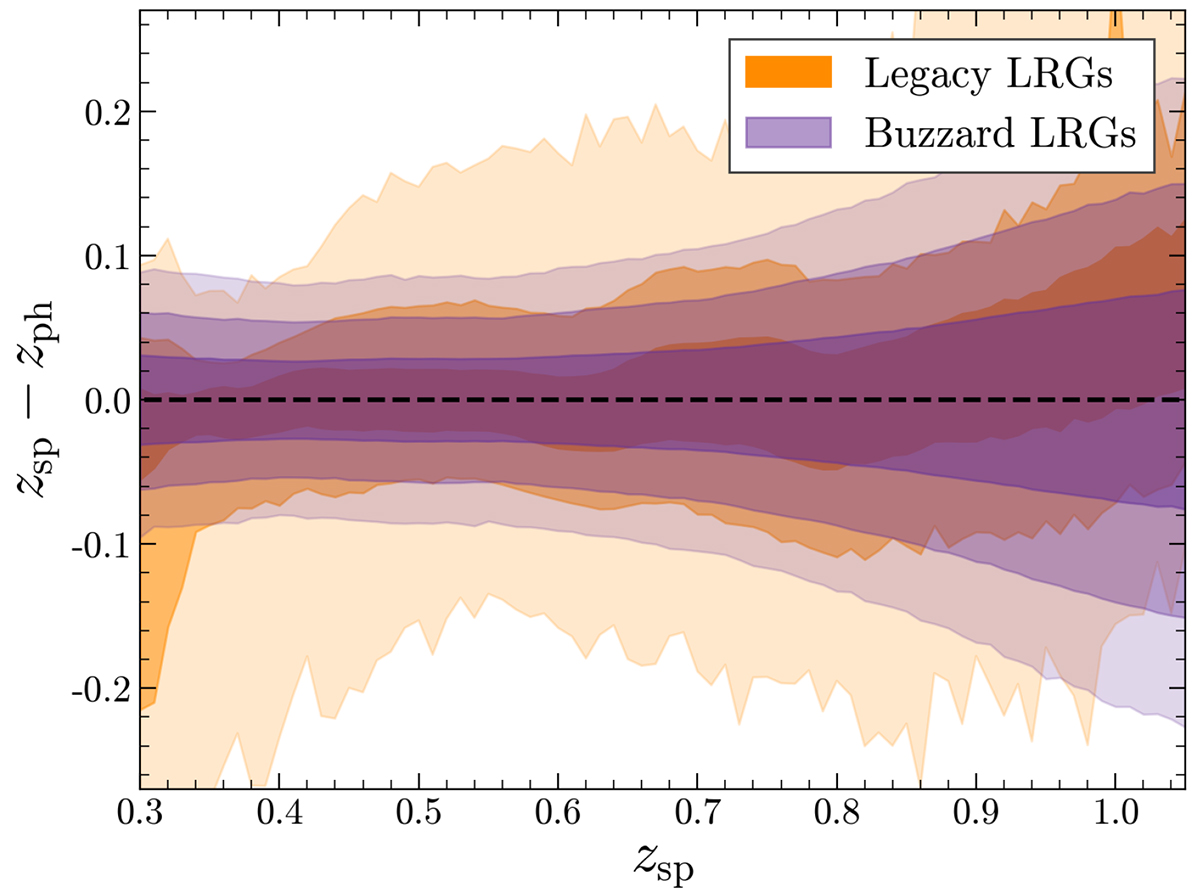
Redshift error distributions for the observed and one simulated LRG data sets, shown in orange and purple, respectively, at the 68.27th, 95.45th, and 99.73th percentiles. Darker shades represent smaller percentile ranges. The two distributions exhibit distinct trends and deviations from zero, which must be corrected to ensure proper matching between observations and mocks.
Current usage metrics show cumulative count of Article Views (full-text article views including HTML views, PDF and ePub downloads, according to the available data) and Abstracts Views on Vision4Press platform.
Data correspond to usage on the plateform after 2015. The current usage metrics is available 48-96 hours after online publication and is updated daily on week days.
Initial download of the metrics may take a while.