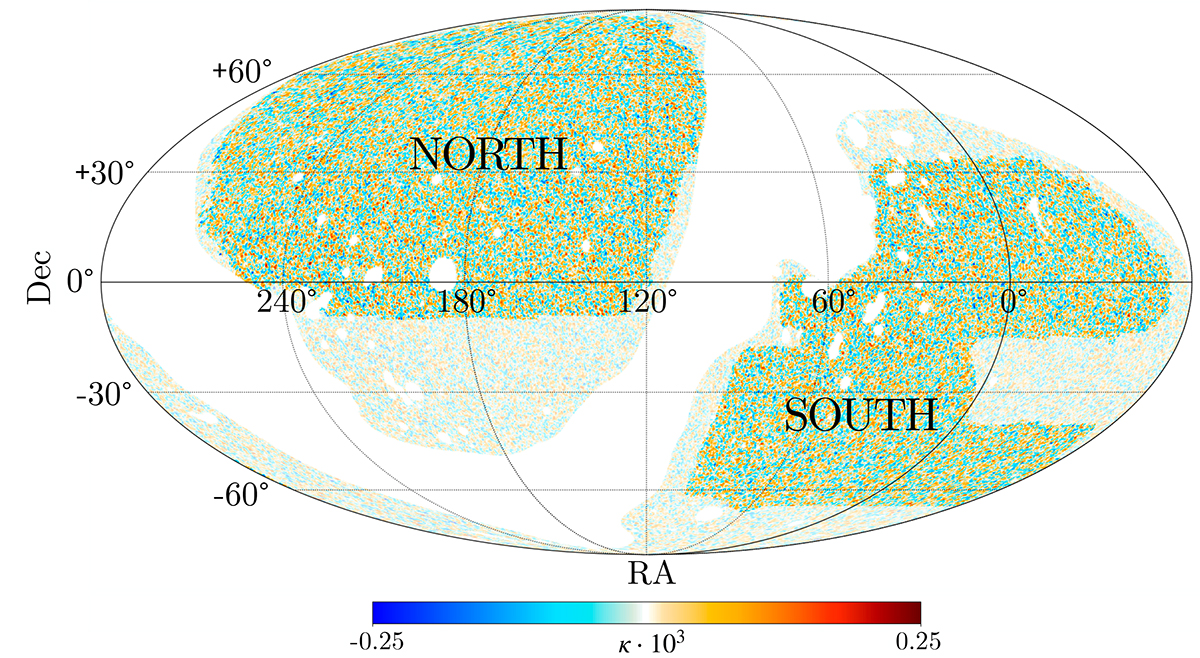
Fig. 2.

Download original image
Planck CMB lensing map, smoothed with a Gaussian filter of FWHM = 0.5°. The DESI Legacy Survey footprint is overlaid, indicating the region where voids are identified and cross-correlations are performed. The footprint is divided into North and South regions, corresponding to the North and South Galactic Caps. CMB regions with negative and positive convergence values are represented by the blue and red ranges of the color palette, respectively.
Current usage metrics show cumulative count of Article Views (full-text article views including HTML views, PDF and ePub downloads, according to the available data) and Abstracts Views on Vision4Press platform.
Data correspond to usage on the plateform after 2015. The current usage metrics is available 48-96 hours after online publication and is updated daily on week days.
Initial download of the metrics may take a while.


