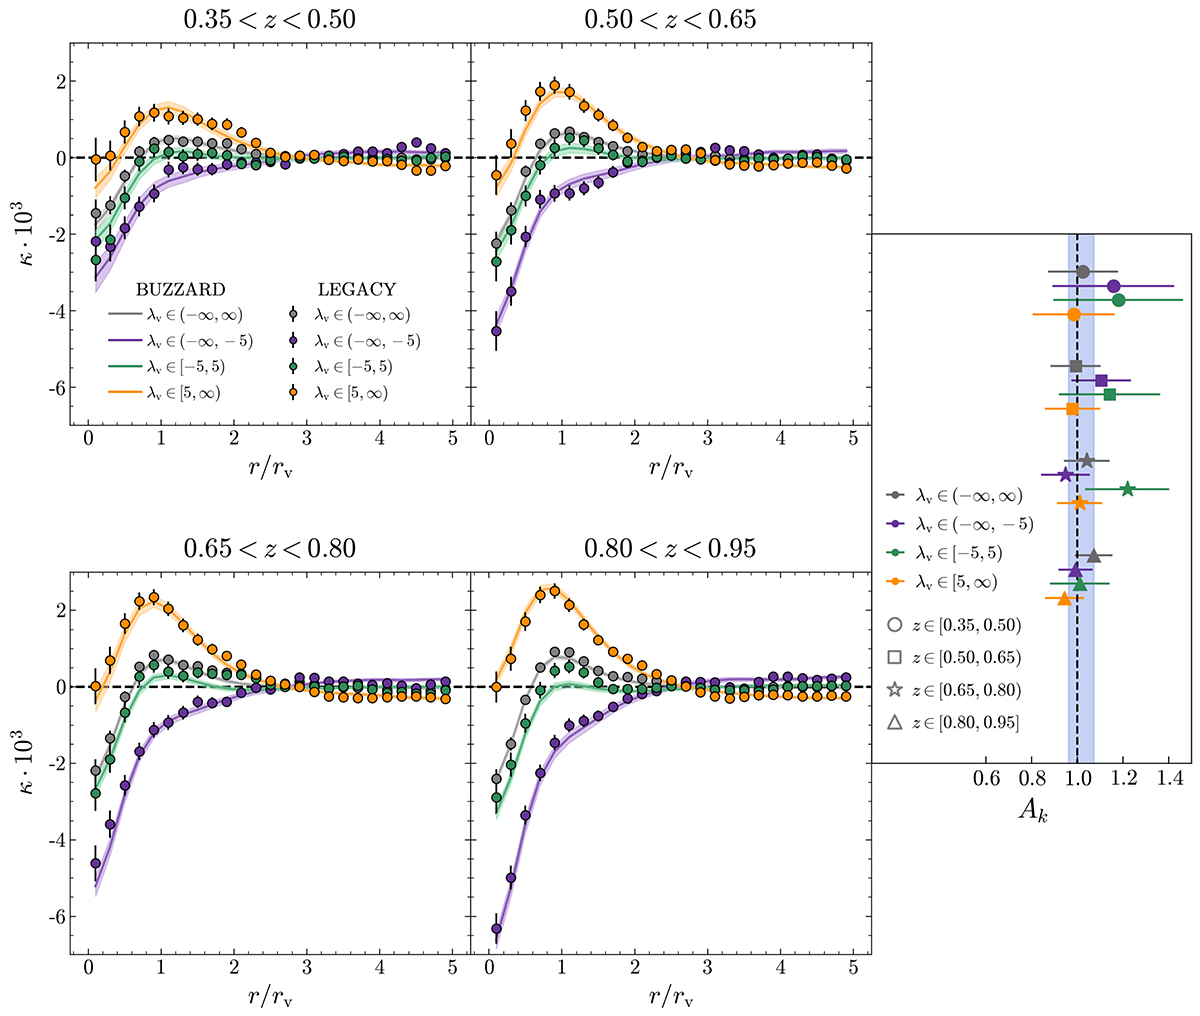
Fig. 13.
Download original image
Left: Tomographic cross-correlation signals for the voids identified in the full-sky DESI Legacy Survey and the corresponding calibrated Buzzard mock realizations. The measurements are provided for the full void samples and the three different λv bins, analyzed in four equispaced redshift bins with Δz = 0.15. Right: Summary of Aκ values for the various measurements (see Table 4). The blue vertical band indicates the 1σ confidence intervals for the full void samples from Fig. 12.
Current usage metrics show cumulative count of Article Views (full-text article views including HTML views, PDF and ePub downloads, according to the available data) and Abstracts Views on Vision4Press platform.
Data correspond to usage on the plateform after 2015. The current usage metrics is available 48-96 hours after online publication and is updated daily on week days.
Initial download of the metrics may take a while.