Fig. 11.
Download original image
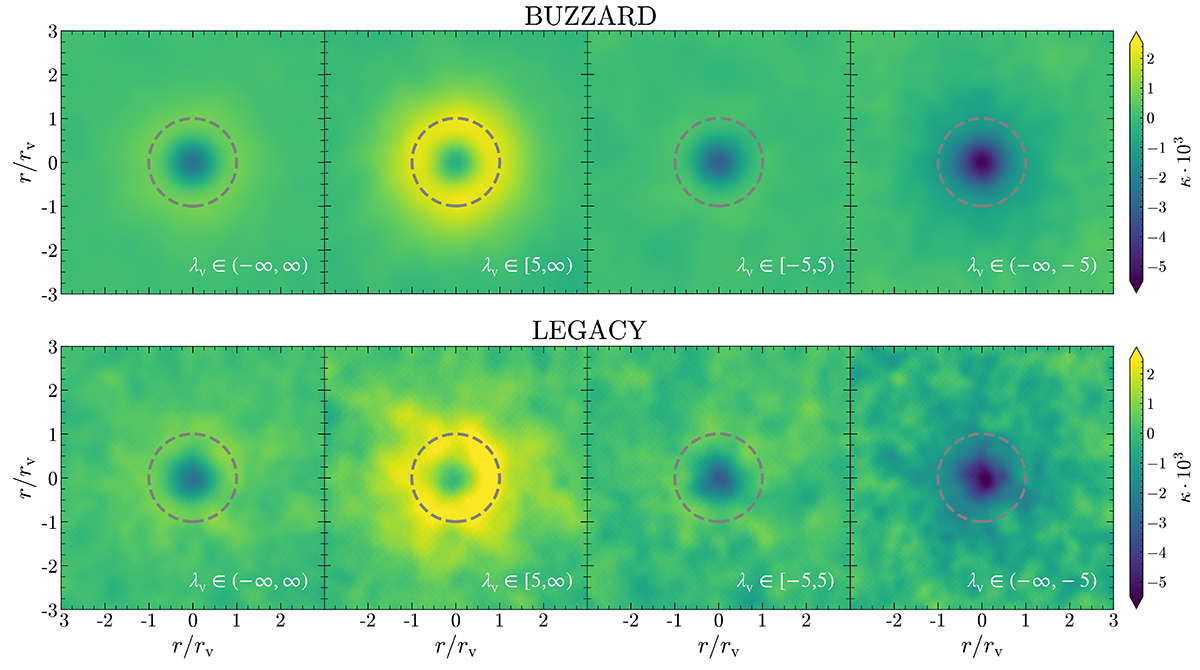
Stacked images of the simulated cross-correlation from the Buzzard mocks (top) and the observed (bottom) cross-correlation between the full-sky void data set from the Legacy Survey and the Planck CMB convergence map. The first column displays the stacked images for the full void population, while the subsequent three columns correspond to void bins categorized by λv, ranging from positive to negative values. Despite the presence of instrumental noise in the observed stacked CMB patches, the images exhibit strong visual agreement between simulations and observations, clearly illustrating the distinct properties of the different void populations analyzed.
Current usage metrics show cumulative count of Article Views (full-text article views including HTML views, PDF and ePub downloads, according to the available data) and Abstracts Views on Vision4Press platform.
Data correspond to usage on the plateform after 2015. The current usage metrics is available 48-96 hours after online publication and is updated daily on week days.
Initial download of the metrics may take a while.