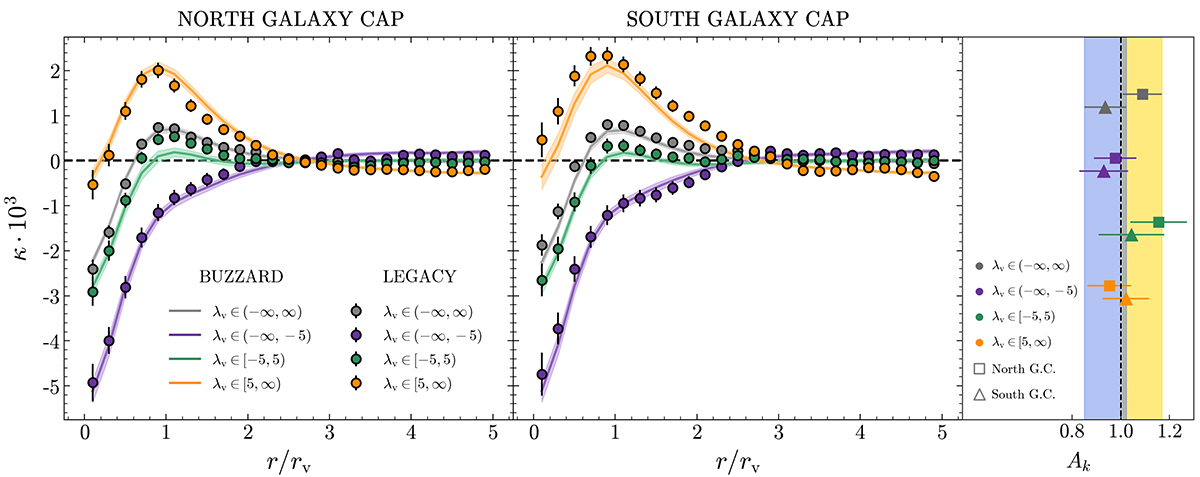
Fig. 10.
Download original image
Cross-correlation signals for the voids identified in the North (left) and South (center) regions of DESI Legacy Survey and the corresponding calibrated Buzzard mock realizations. Measurements are shown for the full void samples and the three different λv bins considered. The Aκ values for the various measurements are summarized in the right panel (see Table 2), with yellow and blue vertical bands indicating the 1σ confidence intervals for the full void samples of the North and South regions, respectively.
Current usage metrics show cumulative count of Article Views (full-text article views including HTML views, PDF and ePub downloads, according to the available data) and Abstracts Views on Vision4Press platform.
Data correspond to usage on the plateform after 2015. The current usage metrics is available 48-96 hours after online publication and is updated daily on week days.
Initial download of the metrics may take a while.