Fig. 15
Download original image
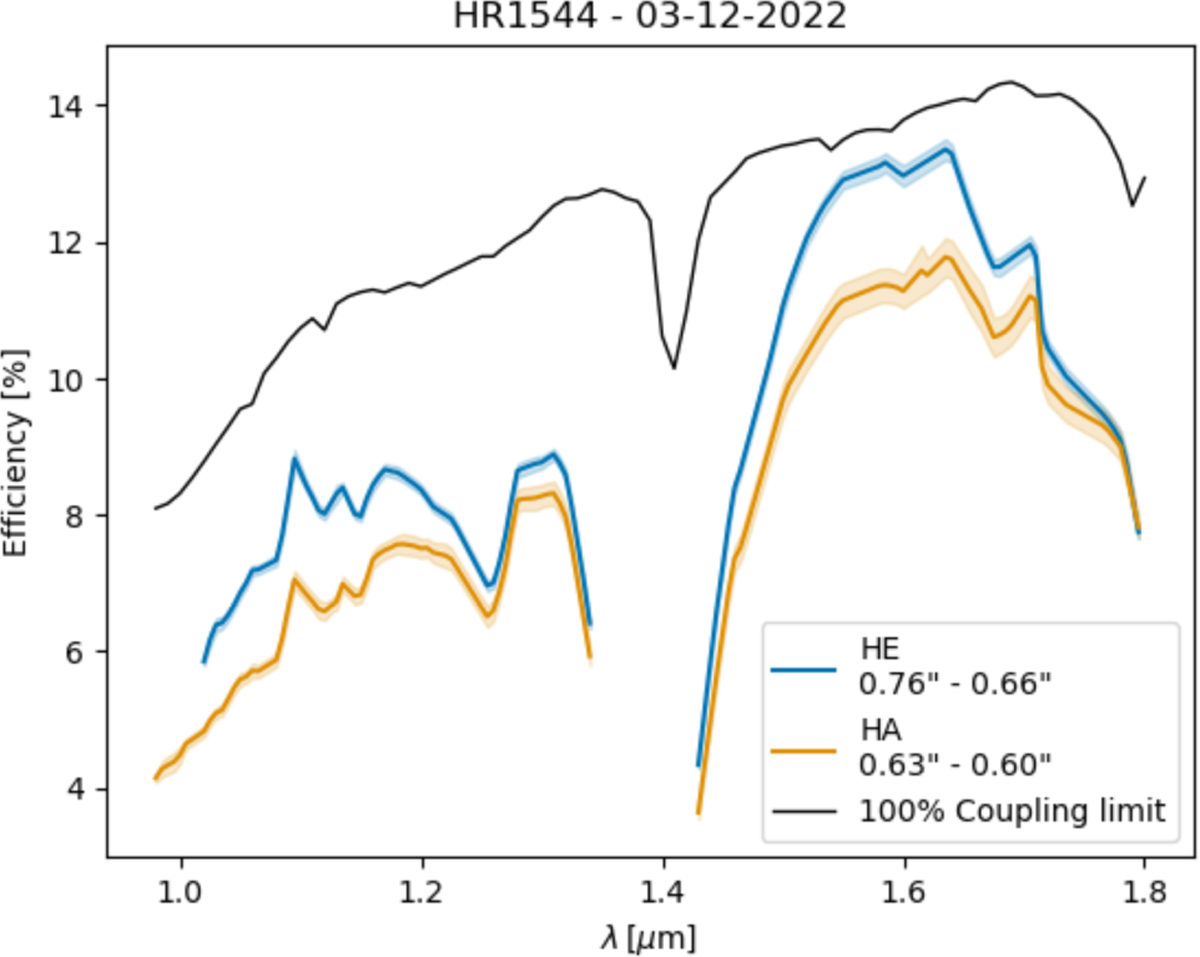
Overall efficiency curves of NIRPS measured on the spectrophotometric standard star HR1544 observed on 3 December 2022 under extremely good seeing conditions. The solid line shows the upper envelope of the resulting efficiency curves, and the shaded area indicates the standard deviation. The values in the legend show the seeing at the beginning of the first observation and the end of the last observation. The black curve represents the ideal case of 100% coupling limit for seeing of 0.9″ in the YJH-band.
Current usage metrics show cumulative count of Article Views (full-text article views including HTML views, PDF and ePub downloads, according to the available data) and Abstracts Views on Vision4Press platform.
Data correspond to usage on the plateform after 2015. The current usage metrics is available 48-96 hours after online publication and is updated daily on week days.
Initial download of the metrics may take a while.