Fig. 3.
Download original image
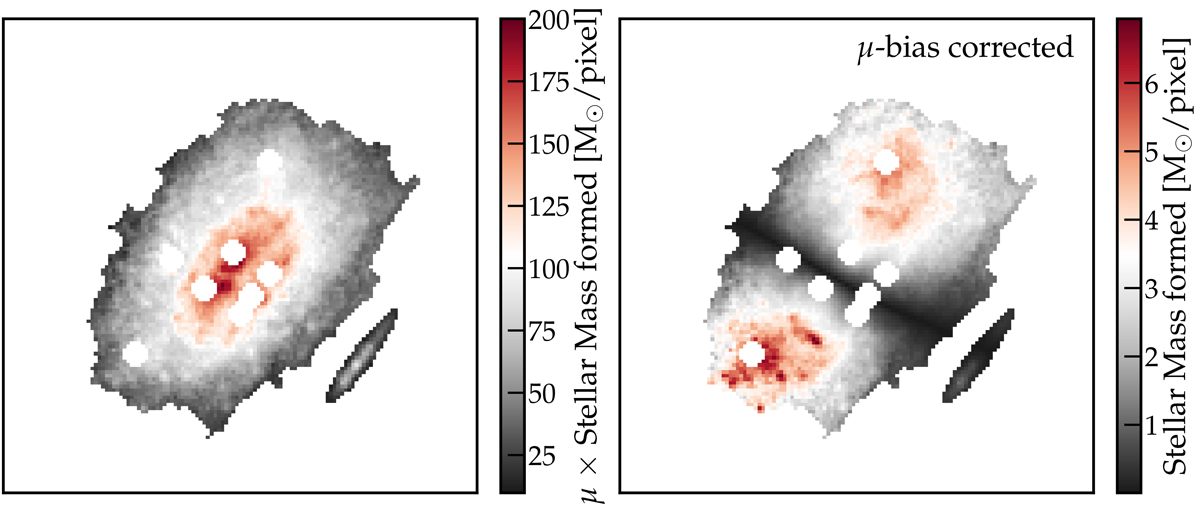
Distribution of total stellar mass formed per pixel in Warhol throughout the entire SFH shown before and after accounting for magnification bias correction, in the left and right panels respectively. Brighter pixels may suggest a larger stellar mass, but magnification can make smaller stellar populations appear brighter, which would introduce a bias. To correct for this effect, we divide the stellar mass formed in each pixel by μm, which accounts for the change in source-plane area relative to the lens-plane pixel area due to magnification. Near the critical curve, the number of stars in the source plane imaged in this region is lower than in areas with lower magnification, but the magnification is extremely large, which enables the detection of individual fainter stars but within a reduced source area. One pixel corresponds to 32 mas, or 490 pc on the source plane if μ = 1.
Current usage metrics show cumulative count of Article Views (full-text article views including HTML views, PDF and ePub downloads, according to the available data) and Abstracts Views on Vision4Press platform.
Data correspond to usage on the plateform after 2015. The current usage metrics is available 48-96 hours after online publication and is updated daily on week days.
Initial download of the metrics may take a while.