Fig. 2.
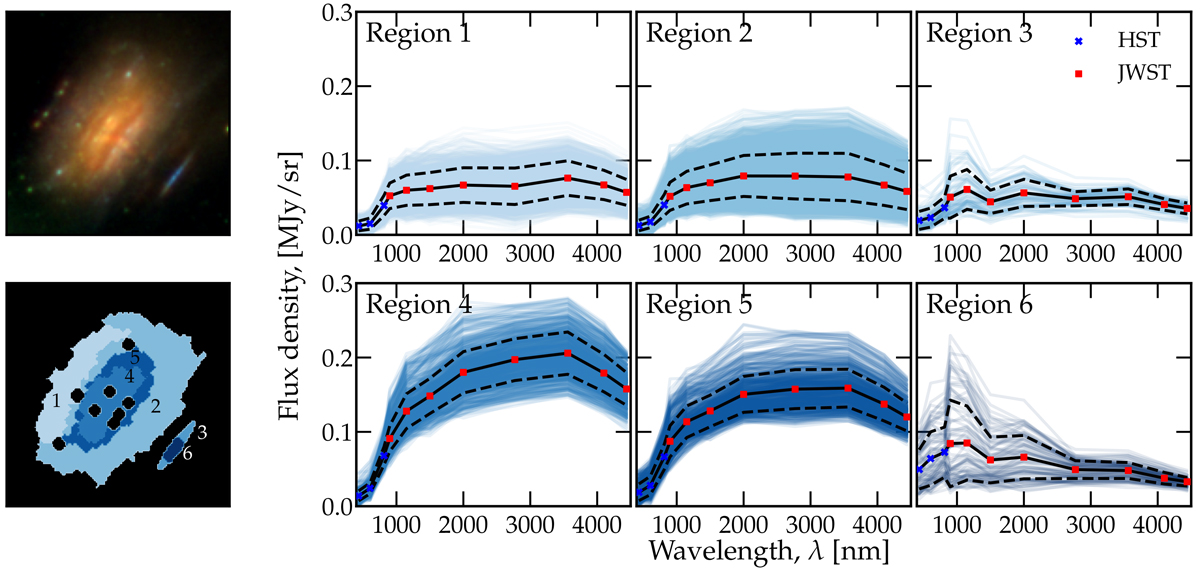
Download original image
Similar SED regions after clustering. Top-left panel: Colour image of Warhol. Bottom-left panel: regions of similar SED pixels on Warhol. Black dots indicate masked regions, globular clusters from the intracluster medium, or transient events whose SEDs do not represent the underlying stellar population. Second, third, and fourth columns: SEDs for each pixel in the different regions. The solid black line represents the median SED, while the dashed black lines indicate the 1σ contour. Violet crosses and red squares indicate the photometric measurements obtained using HST and JWST filters, respectively, all introduced in Section 2.
Current usage metrics show cumulative count of Article Views (full-text article views including HTML views, PDF and ePub downloads, according to the available data) and Abstracts Views on Vision4Press platform.
Data correspond to usage on the plateform after 2015. The current usage metrics is available 48-96 hours after online publication and is updated daily on week days.
Initial download of the metrics may take a while.