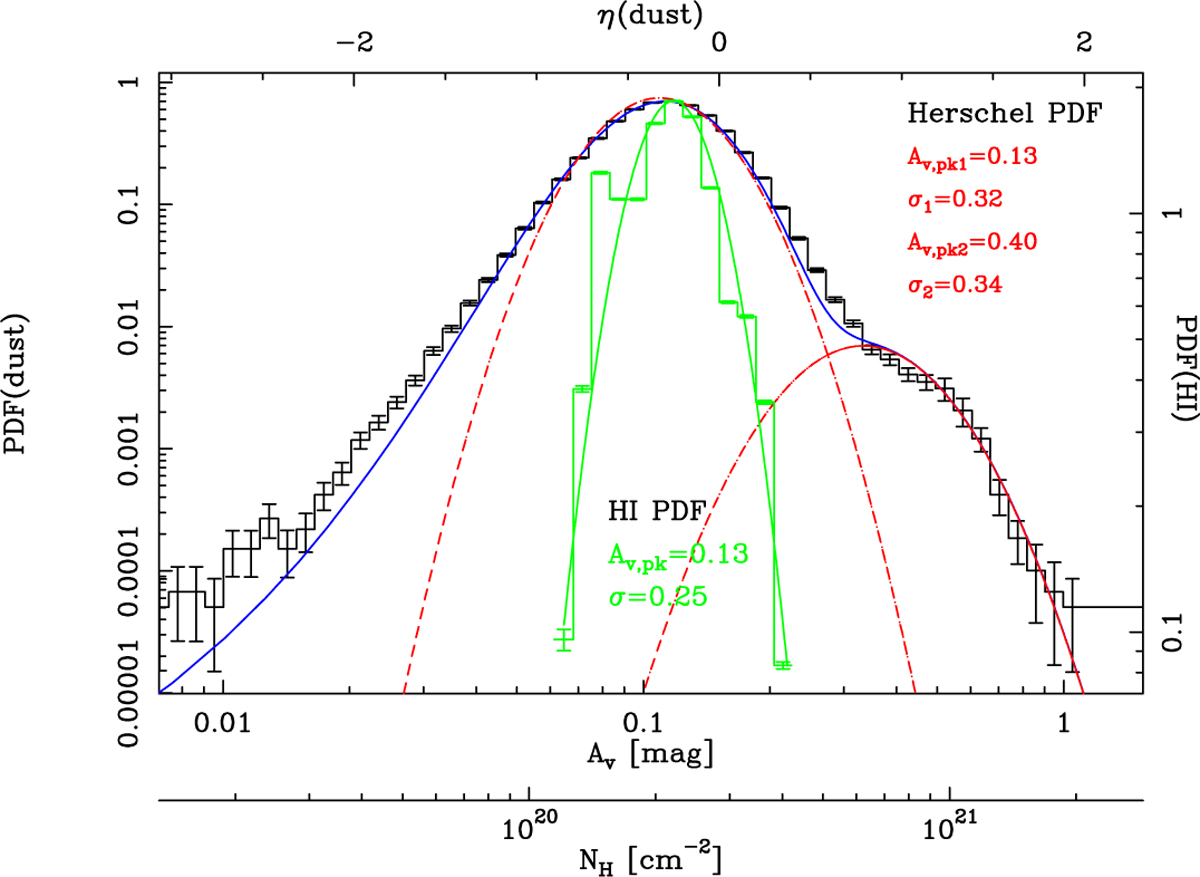
Fig. B.1
Download original image
N-PDF of Draco from Schneider et al. (2022). The black histogram indicates the N-PDF obtained from Herschel data and the blue line its analytic description. The dashed red line gives the fit of two lognormal PDFs and takes into consideration the noise contribution that leads to a nearly linear behaviour at low column densities (Ossenkopf-Okada et al. 2016). The green histogram displays the NHI-PDF of the HI data, and the continuous line a single log-normal fit. The fitted peak positions of the PDFs and the widths (σ in units of η=ln(N/〈N〉)) are given in the panel. Error bars are based on the method presented in Jaupart & Chabrier (2022). The left y-axis gives the probability value for the Herschel map, and the right y-axis for the H I map.
Current usage metrics show cumulative count of Article Views (full-text article views including HTML views, PDF and ePub downloads, according to the available data) and Abstracts Views on Vision4Press platform.
Data correspond to usage on the plateform after 2015. The current usage metrics is available 48-96 hours after online publication and is updated daily on week days.
Initial download of the metrics may take a while.