Fig. 5
Download original image
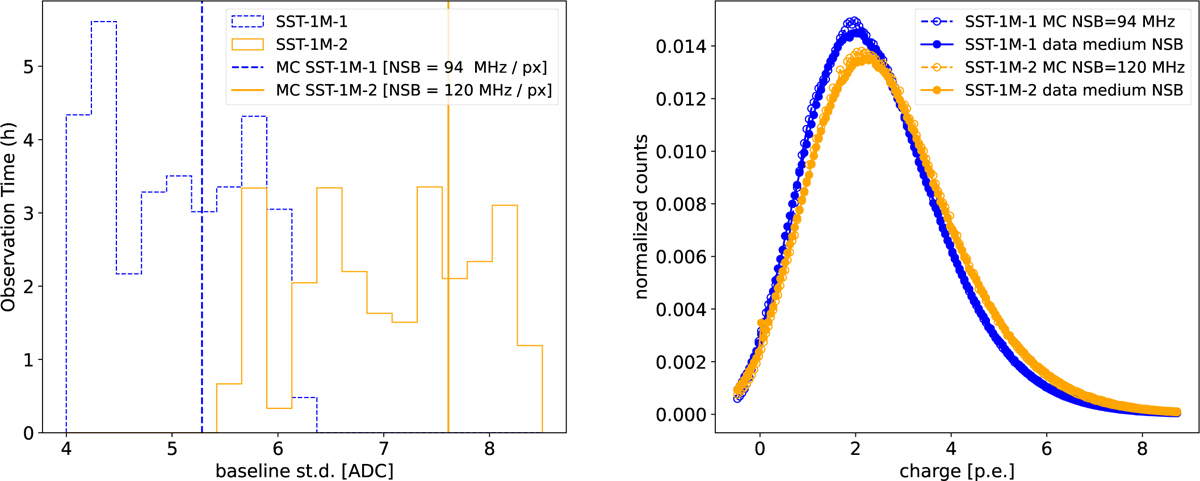
Left : distribution of the averaged standard deviation of the baselines for SST-1M-1 (dashed line) and SST-1M-2 (solid line). The vertical lines represent the value assumed in the MC model of SST-1M-1 (94 MHz/pixel) and SST-1M-2 (120 MHz/pixel). The vertical axis represents the number of hours with a baseline standard deviation (on the horizontal axis) in the final Crab Nebula data sample. Right: comparison between the MC-predicted and pedestal events-measured p.e. distributions under the slightly higher than typical NSB conditions during the Crab Nebula observations.
Current usage metrics show cumulative count of Article Views (full-text article views including HTML views, PDF and ePub downloads, according to the available data) and Abstracts Views on Vision4Press platform.
Data correspond to usage on the plateform after 2015. The current usage metrics is available 48-96 hours after online publication and is updated daily on week days.
Initial download of the metrics may take a while.