Fig. 3
Download original image
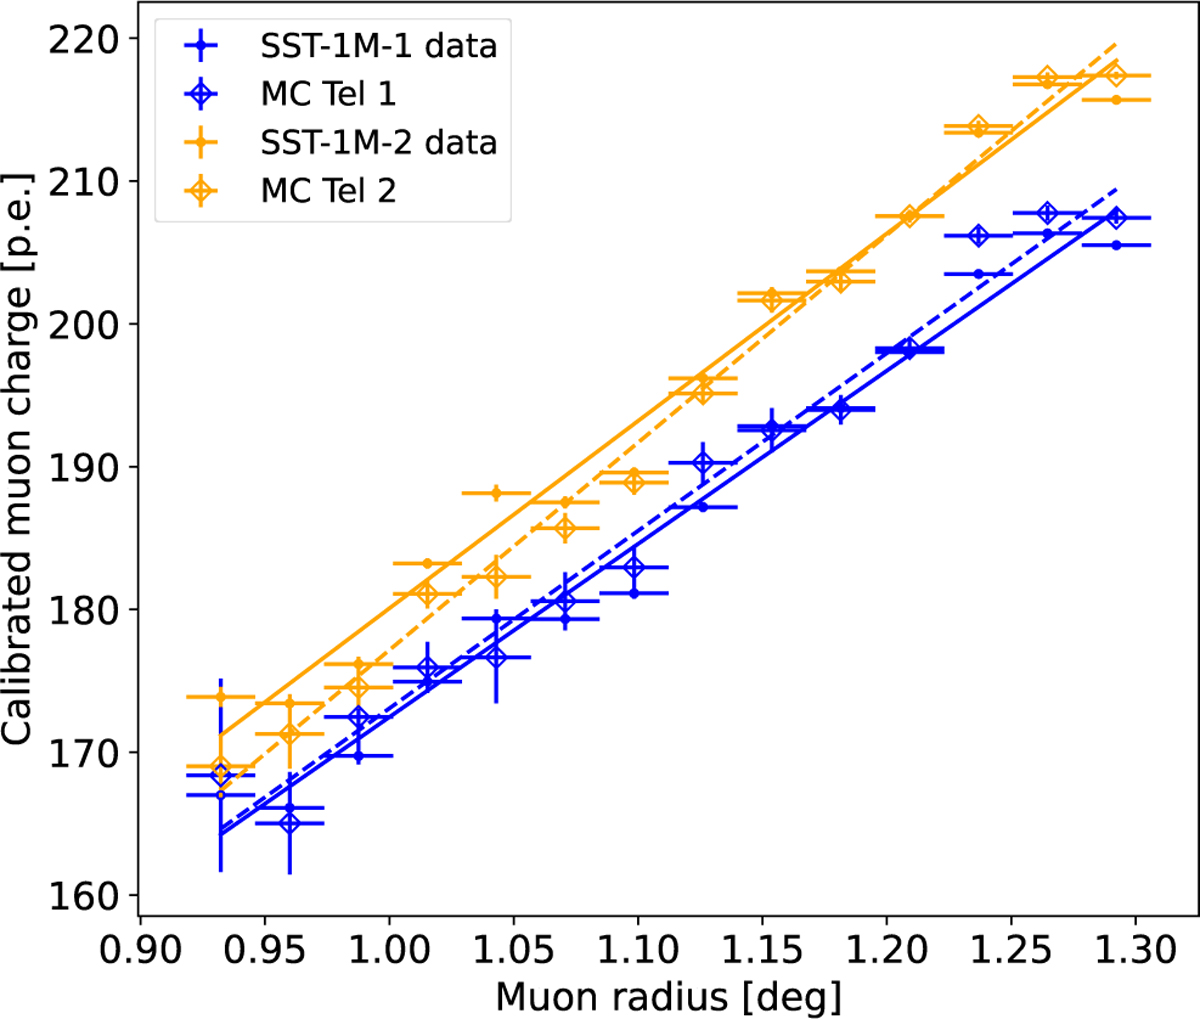
Charge of muon images as a function of the fitted ring radius for SST-1M-1 and SST-1M-2. The solid markers represent observational data collected from September 2023 to April 2024, during the first stereo Crab observation campaign (blue for SST-1M-1 and orange for SST-1M-2). Measured data agree with the MC simulation, shown with open markers and dashed lines. Notable differences between SST-1M-1 and SST-1M-2 arise from differences in their optical designs.
Current usage metrics show cumulative count of Article Views (full-text article views including HTML views, PDF and ePub downloads, according to the available data) and Abstracts Views on Vision4Press platform.
Data correspond to usage on the plateform after 2015. The current usage metrics is available 48-96 hours after online publication and is updated daily on week days.
Initial download of the metrics may take a while.