Fig. 17
Download original image
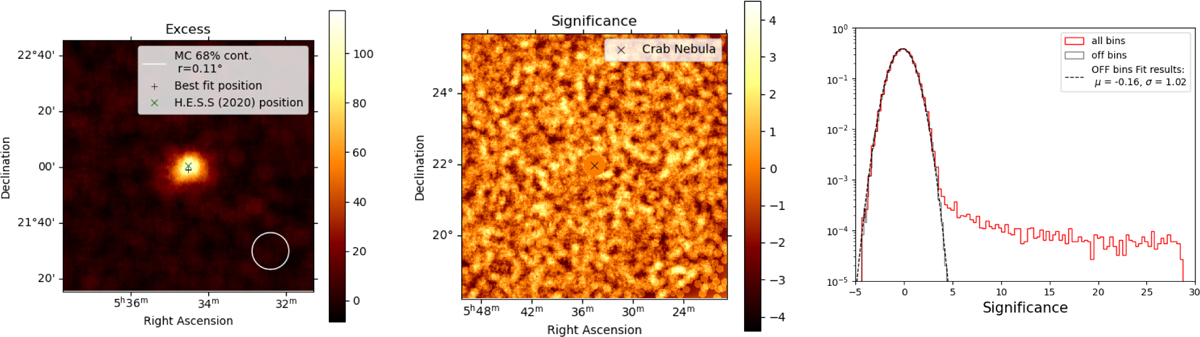
Left : excess map of the Crab Nebula region within a region of 1.5° × 1.5°. The best-fit position of the excess is marked with a “+” symbol, and the expected position of the Crab Nebula, as measured in H.E.S.S. Collaboration (2020), is indicated by the green “x”. The distribution was convolved with a disk kernel of 0.05°. Center: significance map across the 7.5° × 7.5° field of view centered on Crab Nebula position. The map convolved with a disk kernel with a radius of 0.11°. 0.3° region around the Crab Nebula is masked. Right: one-dimensional distribution of the significance values, including all bins (red) and OFF-region bins (gray). The OFF-region significance distribution is fitted by a Gaussian function (dashed black line).
Current usage metrics show cumulative count of Article Views (full-text article views including HTML views, PDF and ePub downloads, according to the available data) and Abstracts Views on Vision4Press platform.
Data correspond to usage on the plateform after 2015. The current usage metrics is available 48-96 hours after online publication and is updated daily on week days.
Initial download of the metrics may take a while.