Fig. 15
Download original image
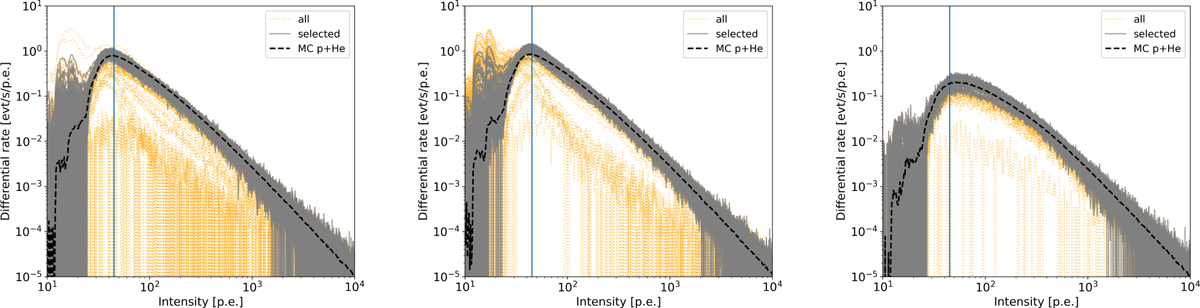
Per-run rates of the event intensities (i.e., only events which survived cleaning contribute to the distributions) for SST-1M-1 mono (left) and SST-1M-2 mono (center), and SST-1M-1 stereo (right). The distributions shown are corrected for cos(zenith). Dotted lines mark all runs taken, solid lines mark runs after selection cuts. The dashed line shows the distribution of MC protons re-weighted on the proton + helium spectrum. The solid blue line marks the intensity threshold of 45 p.e. introduced in the higher-level analysis.
Current usage metrics show cumulative count of Article Views (full-text article views including HTML views, PDF and ePub downloads, according to the available data) and Abstracts Views on Vision4Press platform.
Data correspond to usage on the plateform after 2015. The current usage metrics is available 48-96 hours after online publication and is updated daily on week days.
Initial download of the metrics may take a while.