Fig. 1
Download original image
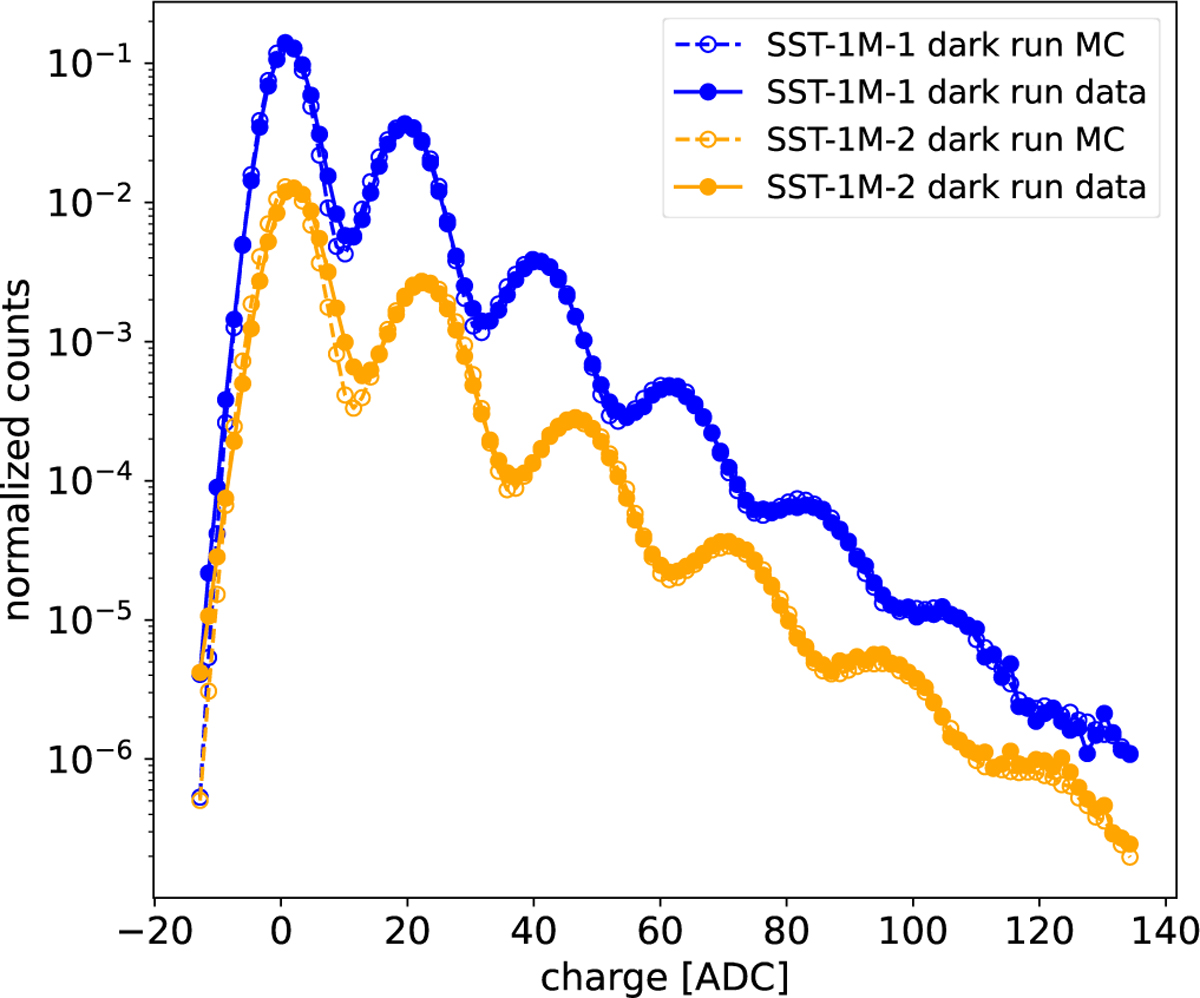
Comparison between data and MC of the normalized (to area) ADC charge distributions extracted from the dark runs for the two telescopes. To avoid overlaps of the two curves, the SST-1M-2 distribution is multiplied by 0.1. Each count is calculated from the 50 samples (200 ns) long waveform in the same manner as done for the triggered data. See the explanation in the text. An asymmetric distribution of the electronic noise (more significant in SST-1M-2) can explain the slight disagreement between the first and the second peak.
Current usage metrics show cumulative count of Article Views (full-text article views including HTML views, PDF and ePub downloads, according to the available data) and Abstracts Views on Vision4Press platform.
Data correspond to usage on the plateform after 2015. The current usage metrics is available 48-96 hours after online publication and is updated daily on week days.
Initial download of the metrics may take a while.