Open Access
Fig. 2
Download original image
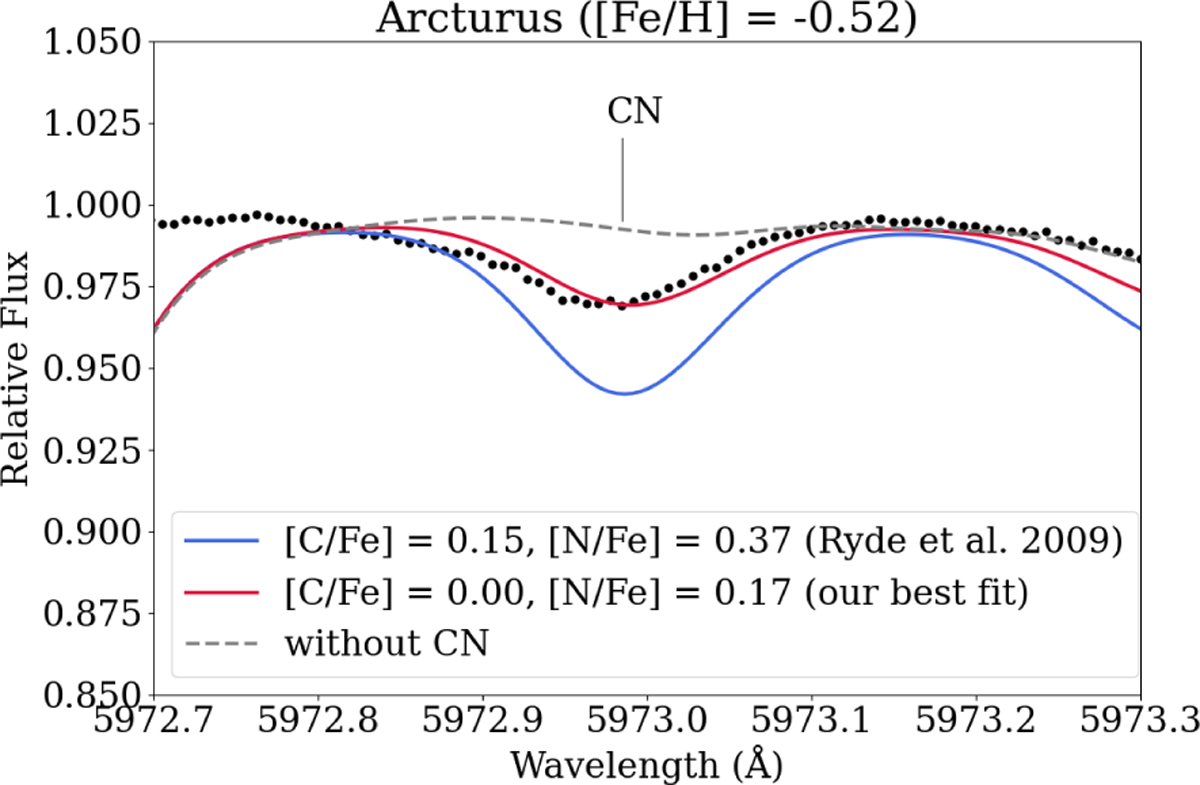
CN line used to constrain the strength of CN absorption. The solid blue line indicates the synthetic spectrum assuming [C/Fe] and [N/Fe] from Ryde et al. (2009), while the solid red line indicates our best-fit result (see Sect. 3.2). The dashed gray line indicates the synthetic spectrum without CN contribution.
Current usage metrics show cumulative count of Article Views (full-text article views including HTML views, PDF and ePub downloads, according to the available data) and Abstracts Views on Vision4Press platform.
Data correspond to usage on the plateform after 2015. The current usage metrics is available 48-96 hours after online publication and is updated daily on week days.
Initial download of the metrics may take a while.