Fig. 1
Download original image
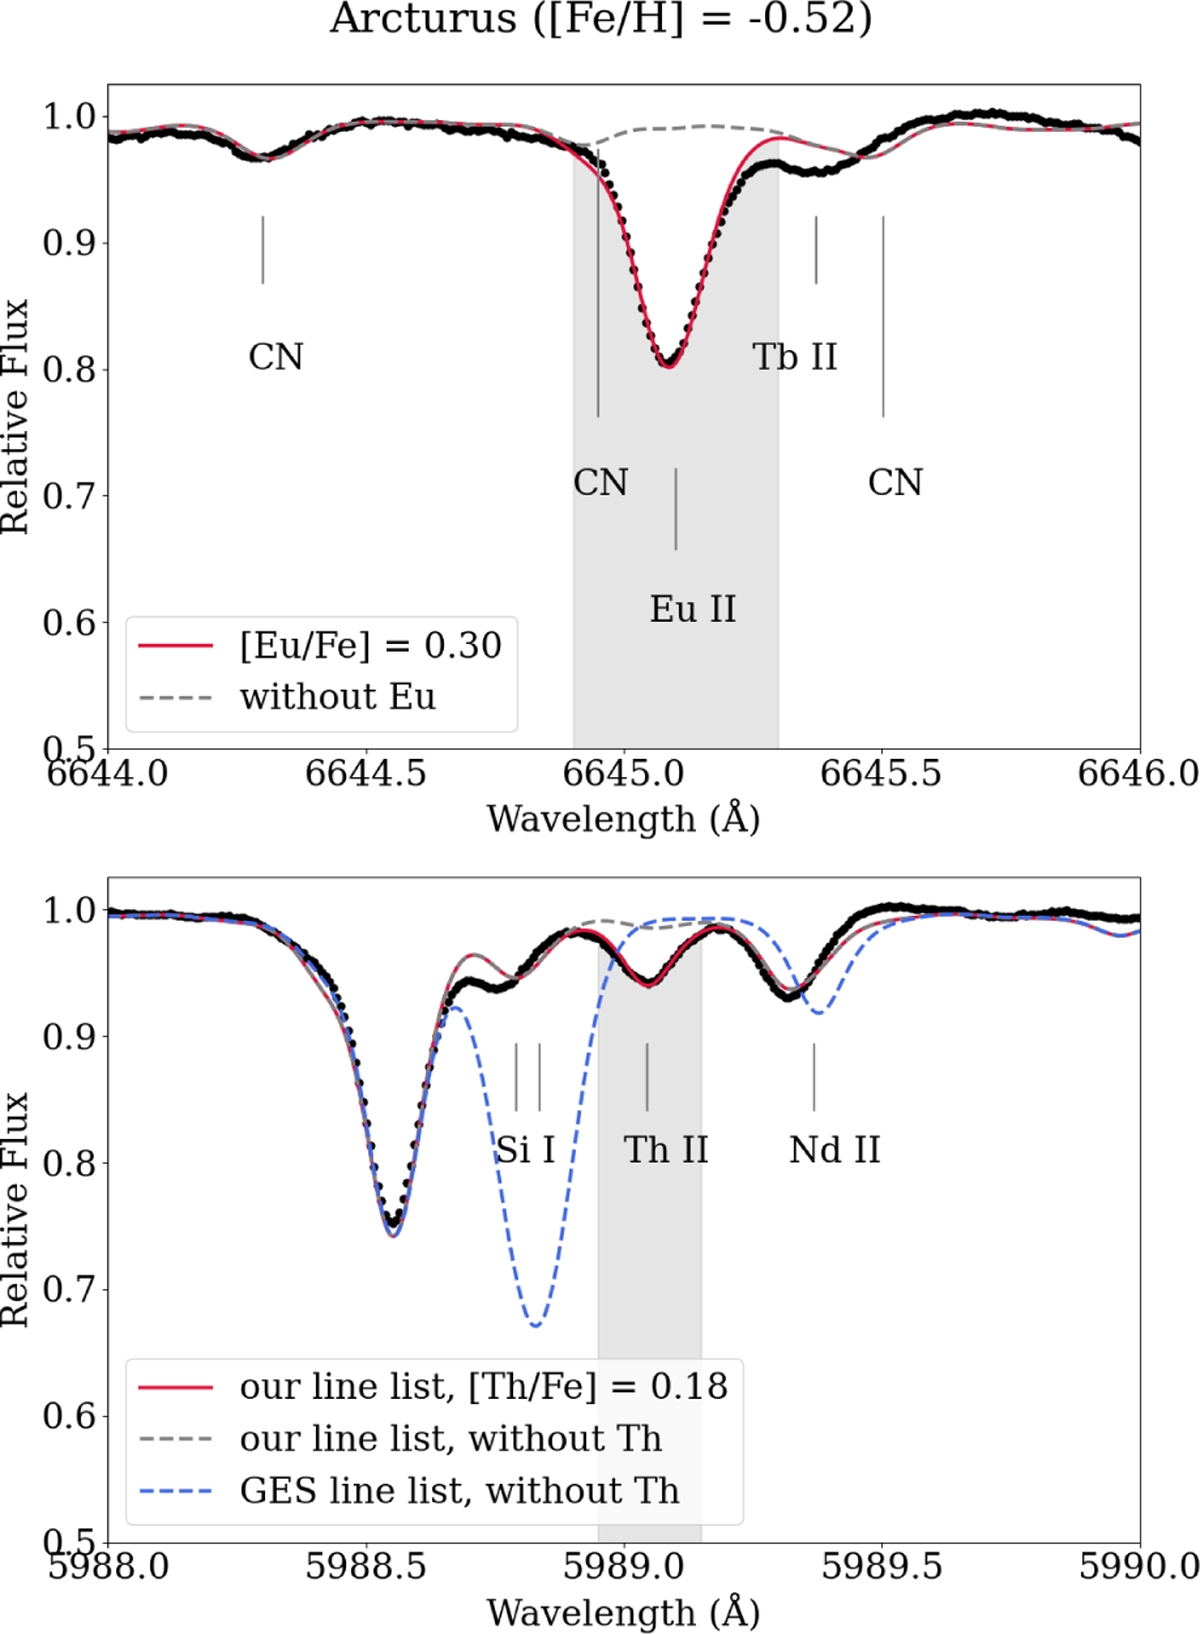
Top panel: our fitting result of the Eu line for Arcturus. The dotted black line shows the observed spectrum; the solid red line shows the best-fit spectrum; and the dashed gray line shows the spectrum without Eu contribution. Bottom panel: our fitting result of the Th line in Arcturus. The dashed blue lines show the synthetic spectrum before the adjustment of the line list; the solid red line shows the final fitting result; and the dashed gray line shows the synthetic spectrum without Th contribution.
Current usage metrics show cumulative count of Article Views (full-text article views including HTML views, PDF and ePub downloads, according to the available data) and Abstracts Views on Vision4Press platform.
Data correspond to usage on the plateform after 2015. The current usage metrics is available 48-96 hours after online publication and is updated daily on week days.
Initial download of the metrics may take a while.