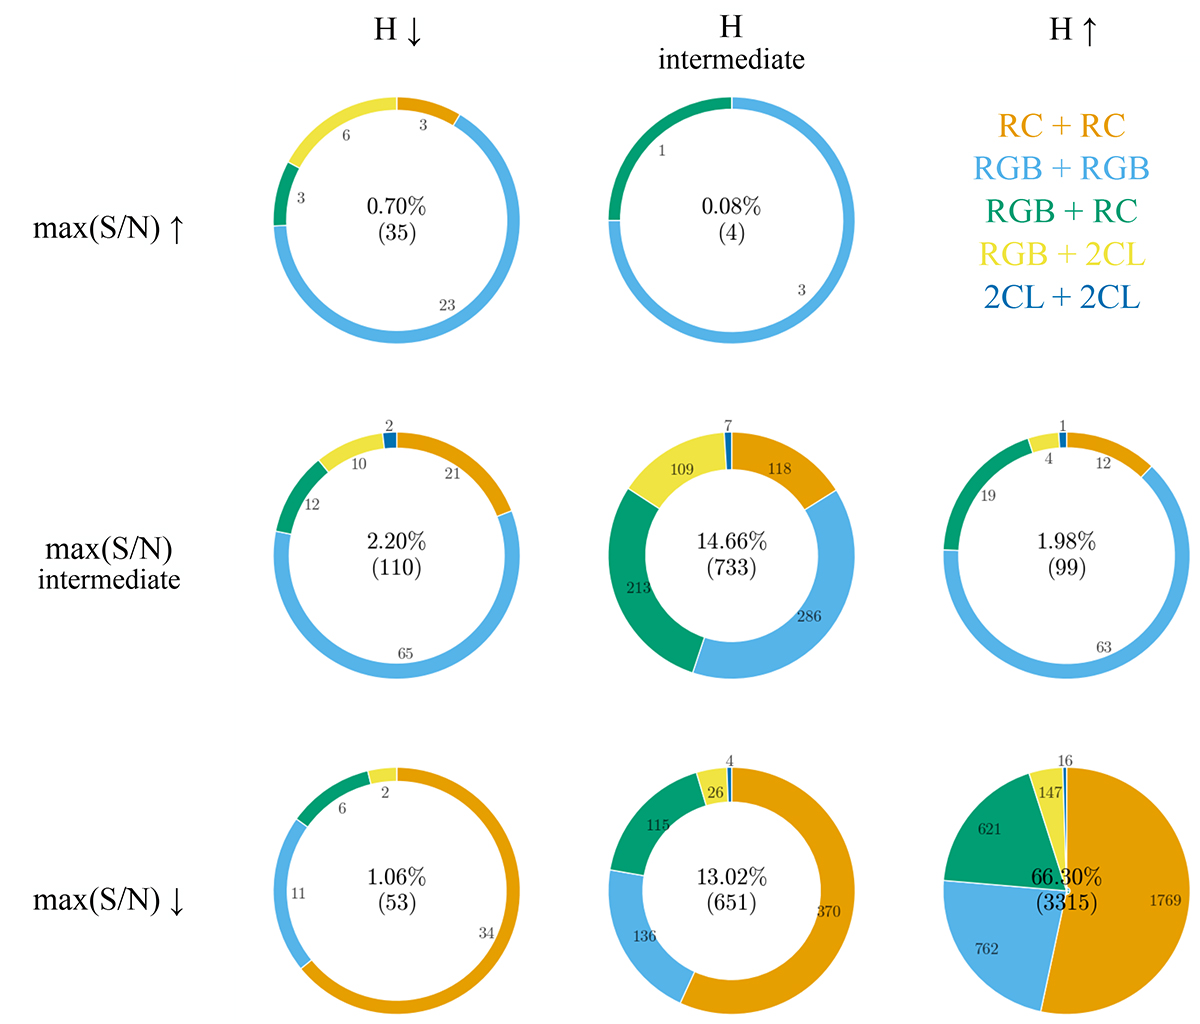
Fig. 7.
Download original image
Categorization of the changes in entropy and maximum S/N for AABs compared to their component stars. From left to right, AABs show lower, intermediate, and higher entropy, while from top to bottom, they exhibit higher, intermediate, and lower maximum S/Ns. The widths of the donut charts indicate the total number of AABs in each category, with larger counts indicated as thicker donuts.
Current usage metrics show cumulative count of Article Views (full-text article views including HTML views, PDF and ePub downloads, according to the available data) and Abstracts Views on Vision4Press platform.
Data correspond to usage on the plateform after 2015. The current usage metrics is available 48-96 hours after online publication and is updated daily on week days.
Initial download of the metrics may take a while.