Fig. 5.
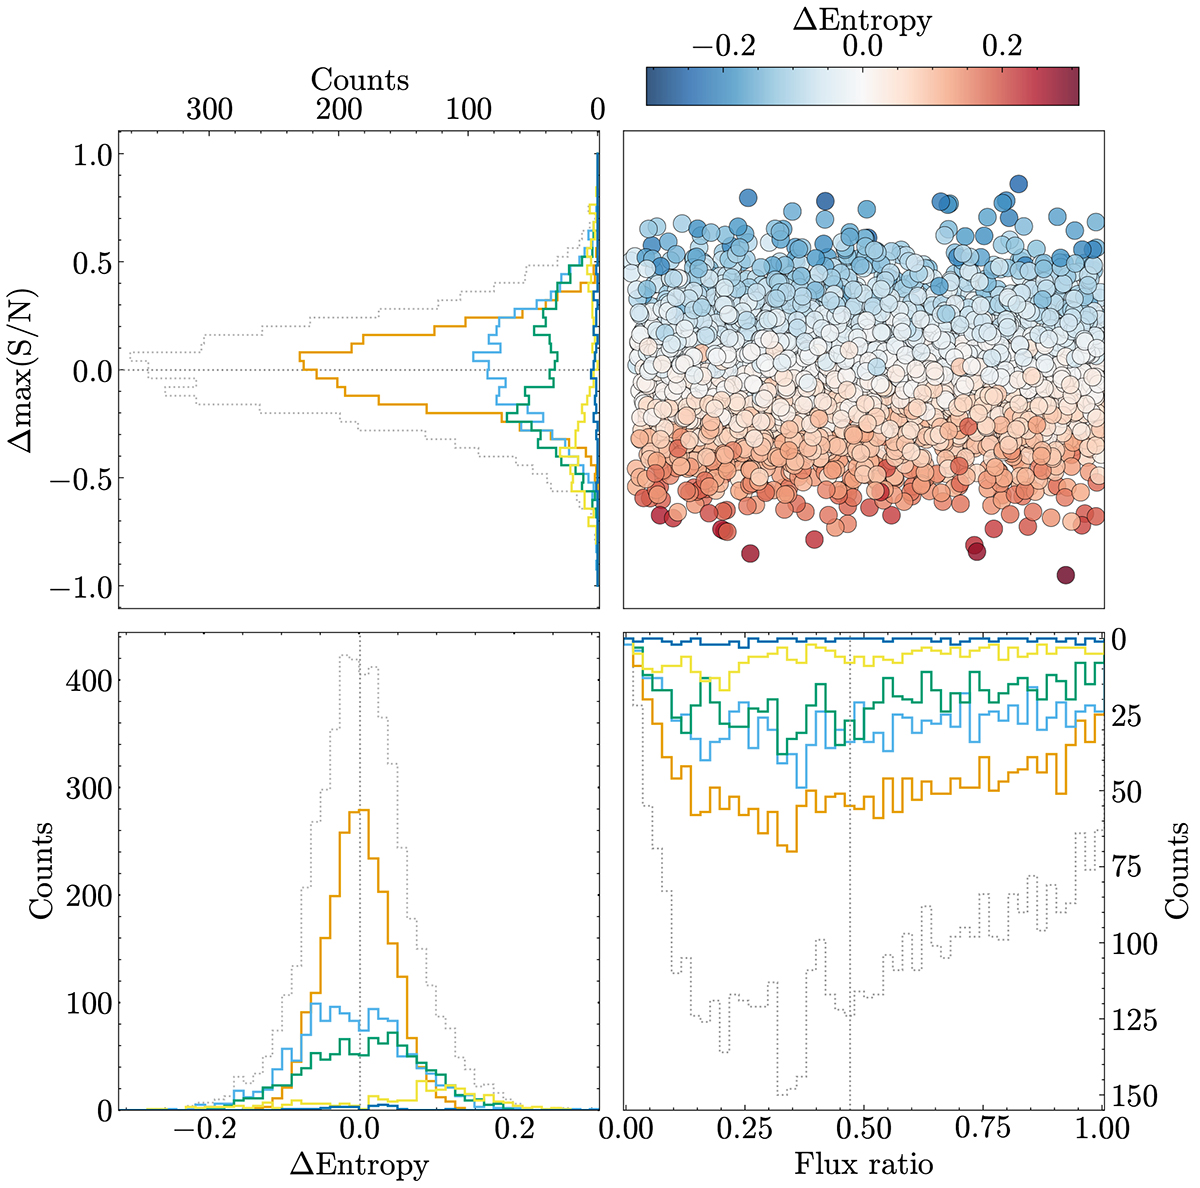
Download original image
Binary components are characterized by flux ratio, entropy, and the maximum S/N of the background-normalized PDS. The upper right panel shows the distribution of flux ratios against the maximum S/N differences, with points color-coded by entropy differences. The adjacent histograms show the respective distributions. The lower left panel shows the entropy difference distribution. The colors of the histograms have the same meaning as in Fig. 4, with dotted gray lines representing all binary components and the vertical lines indicating the medians.
Current usage metrics show cumulative count of Article Views (full-text article views including HTML views, PDF and ePub downloads, according to the available data) and Abstracts Views on Vision4Press platform.
Data correspond to usage on the plateform after 2015. The current usage metrics is available 48-96 hours after online publication and is updated daily on week days.
Initial download of the metrics may take a while.