Fig. 5
Download original image
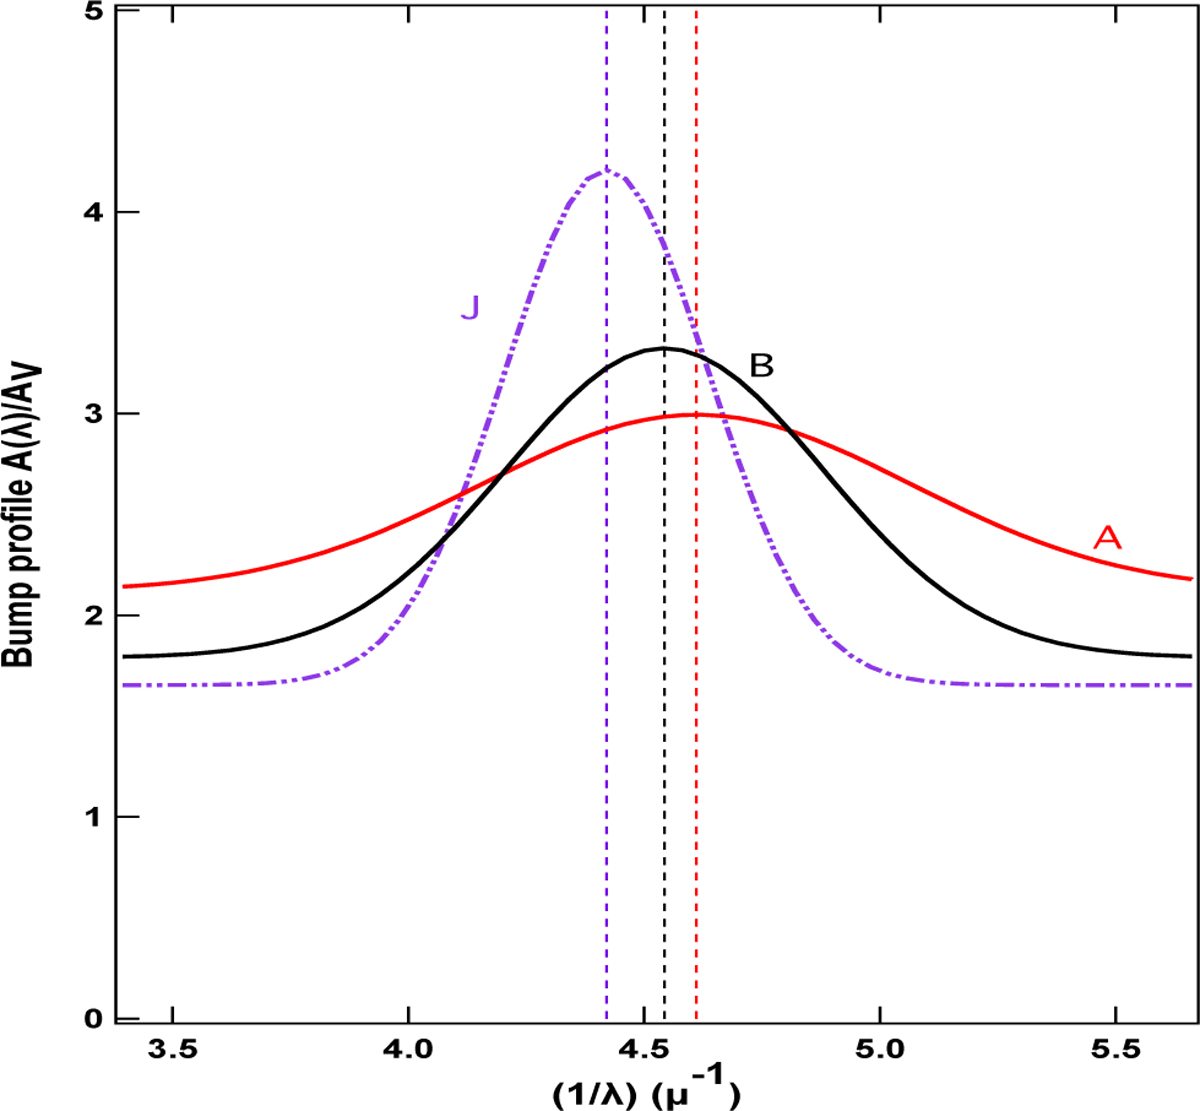
Simplified Gaussian profiles of the bump for different UV bump parameters. The positions and widths of the red (resp. black) profiles correspond to the extrema of the fit linear relationships in Fig. 1, marked by letters A (resp. B) in the two top graphs, corresponding to the 5780 Å DIB. The bump height and the continuum were derived from fit bump height and bump-over-continuum relationships for the same DIB (see text). The position and width of the violet profile are those of the JADES-GS-z6-0 galaxy. The bump height and the continuum were derived by extrapolation of the fit linear relationships to the value EW(5780)/EBV = 2500 (point J in top graph of Fig 1).
Current usage metrics show cumulative count of Article Views (full-text article views including HTML views, PDF and ePub downloads, according to the available data) and Abstracts Views on Vision4Press platform.
Data correspond to usage on the plateform after 2015. The current usage metrics is available 48-96 hours after online publication and is updated daily on week days.
Initial download of the metrics may take a while.