Fig. 4
Download original image
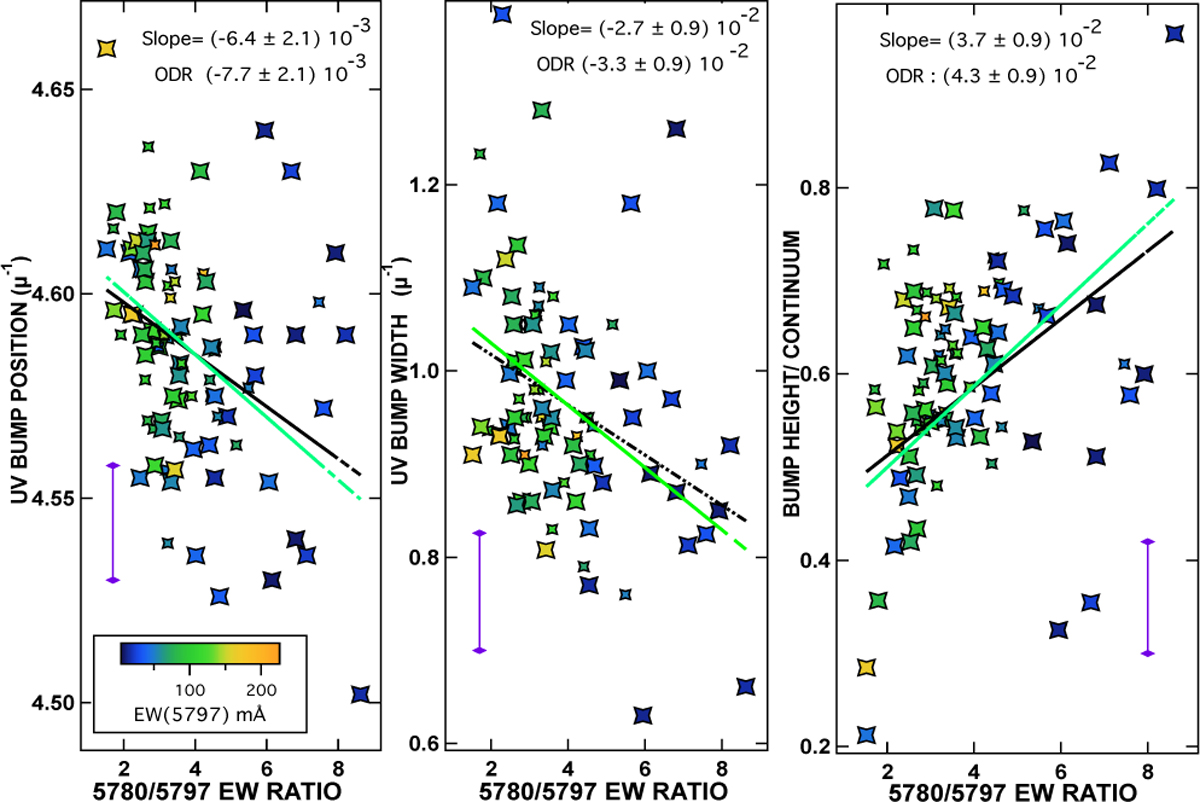
Position, width, and height-to-continuum ratio of the UV bump, here as a function of the unit-less ratio between the 5780 Å DIB EW and the one of the 5797 Å DIB. The color scale refers to the EW of the 5797 Å . It can be seen that the scatter around a mean trend becomes higher for low 5797 Å DIB EWs, and reflects the growing uncertainty on the ratio. The black lines are for the linear fit applied to all stars with FLAG 1, as is described in the text. The green lines are the ODR fits results (see text).
Current usage metrics show cumulative count of Article Views (full-text article views including HTML views, PDF and ePub downloads, according to the available data) and Abstracts Views on Vision4Press platform.
Data correspond to usage on the plateform after 2015. The current usage metrics is available 48-96 hours after online publication and is updated daily on week days.
Initial download of the metrics may take a while.