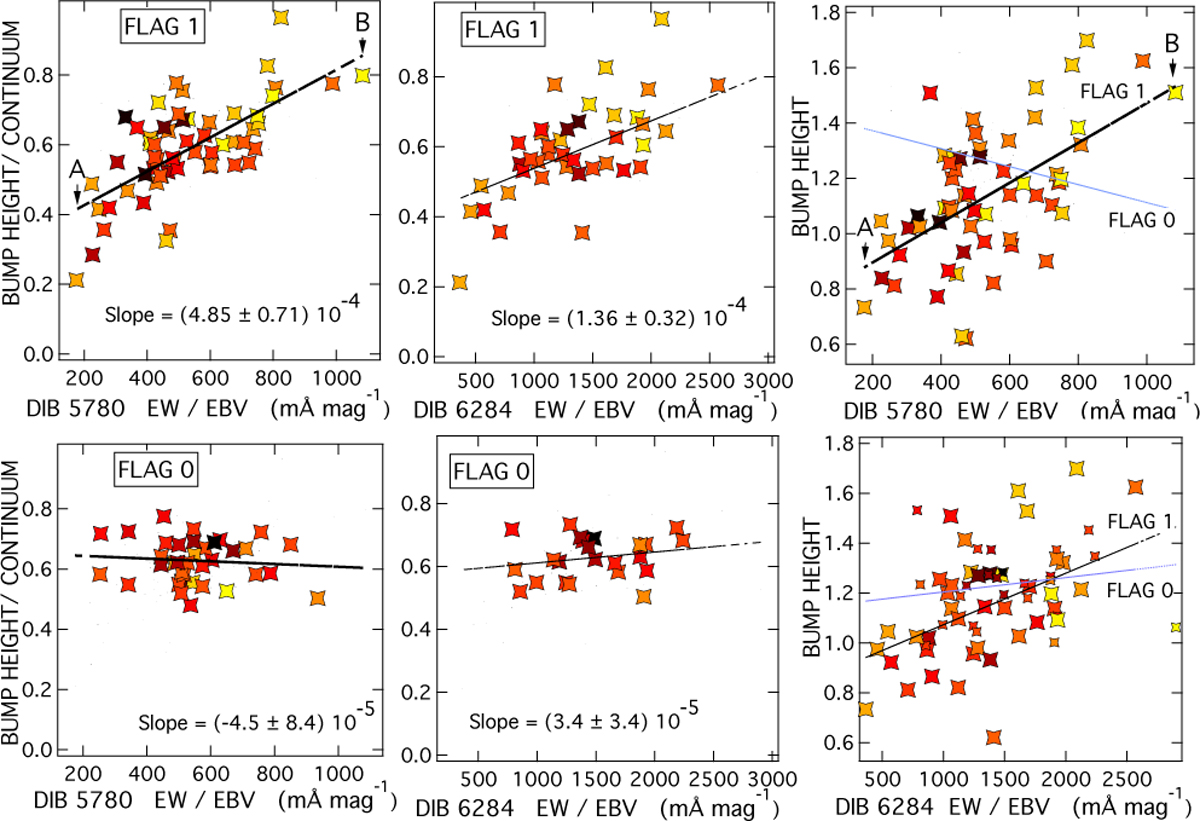
Fig. 3

Download original image
Amplitude of the bump. Left and Middle: ratio between the bump amplitude and the underlying continuum as a function of the 5780 and 6284 Å DIB EW normalized to the reddening. The values correspond to the A(λ)/AV extinction curve. The color scale refers to the LOS extinction, AV, as in Figures 1–2. Note the difference between FLAG 1 ((top) and FLAG 0 (bottom) LOSs. Right: amplitude of the bump for the two DIBs: the fit linear relationships are for Flag 1 LOS (black line) and Flag 0 LOS (pale blue line). The corresponding slopes are 7.2 ± 1.4 10−4, −3.2 ± 1.8 10−4, 2.1 ± 0.6 10−4, and 5.7 ± 7.2 10−5 for 5780/FLAG1, 5780/FLAG0, 6284/FLAG1, and 6284/FLAG0.
Current usage metrics show cumulative count of Article Views (full-text article views including HTML views, PDF and ePub downloads, according to the available data) and Abstracts Views on Vision4Press platform.
Data correspond to usage on the plateform after 2015. The current usage metrics is available 48-96 hours after online publication and is updated daily on week days.
Initial download of the metrics may take a while.


