Fig. A.1.
Download original image
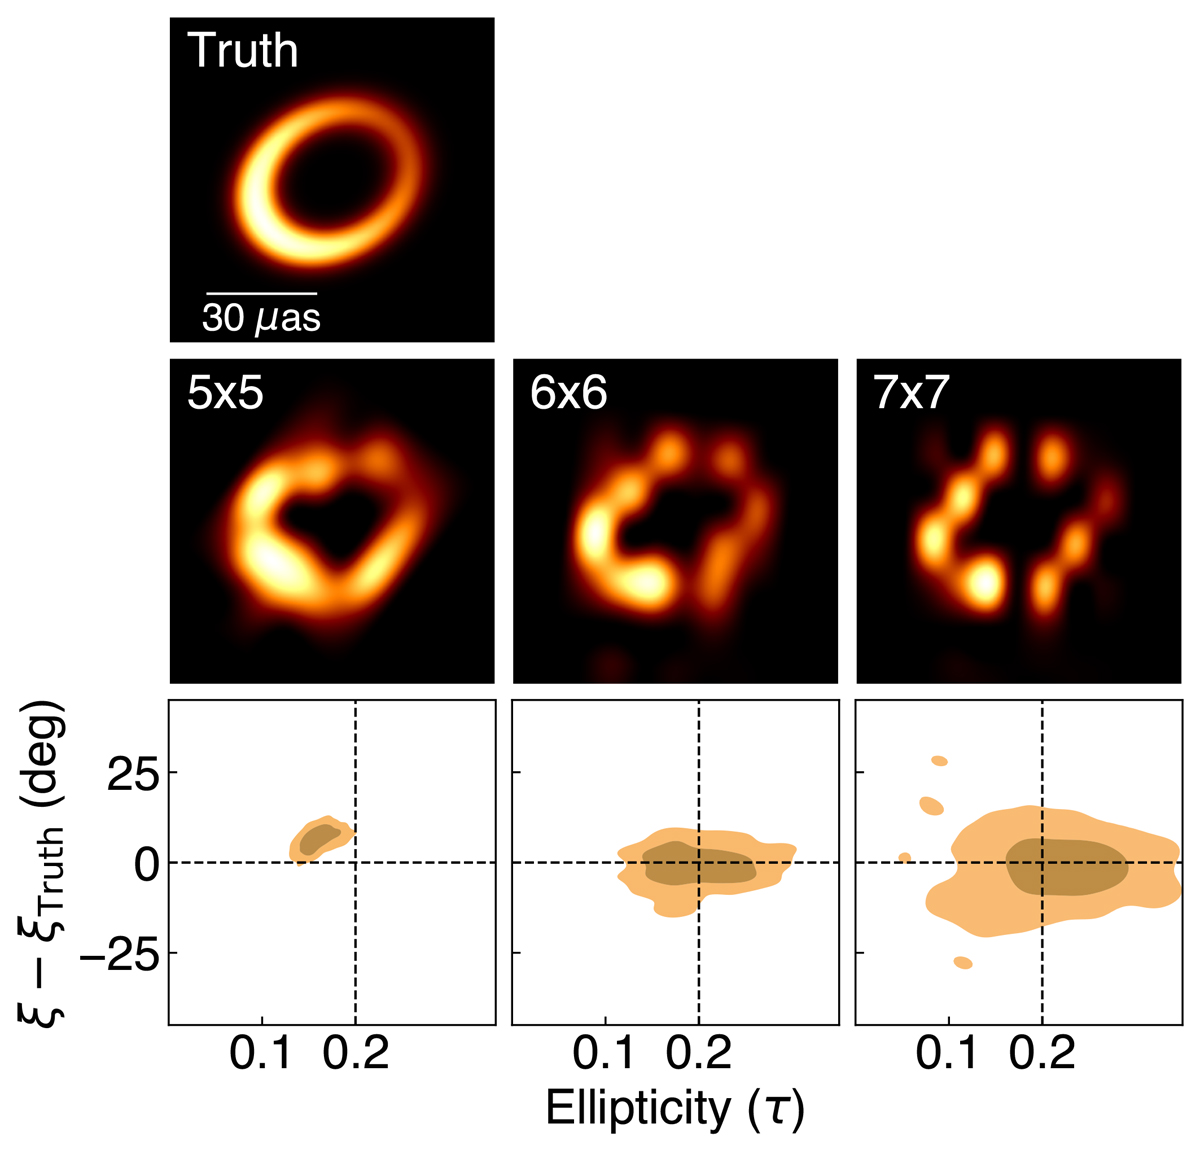
Evaluation of different rasters of THEMIS through synthetic data tests. The true m-ring model with τ=0.1 and ξ=120° is shown on the top. The posterior mean images from THEMIS for 5×5, 6×6, and 7×7 rasters are shown in the middle. τ and ξ - ξTruth posteriors are shown at the bottom. The contours are shown for 68% and 95% confidence intervals. The dashed line marks the truth values.
Current usage metrics show cumulative count of Article Views (full-text article views including HTML views, PDF and ePub downloads, according to the available data) and Abstracts Views on Vision4Press platform.
Data correspond to usage on the plateform after 2015. The current usage metrics is available 48-96 hours after online publication and is updated daily on week days.
Initial download of the metrics may take a while.