Open Access
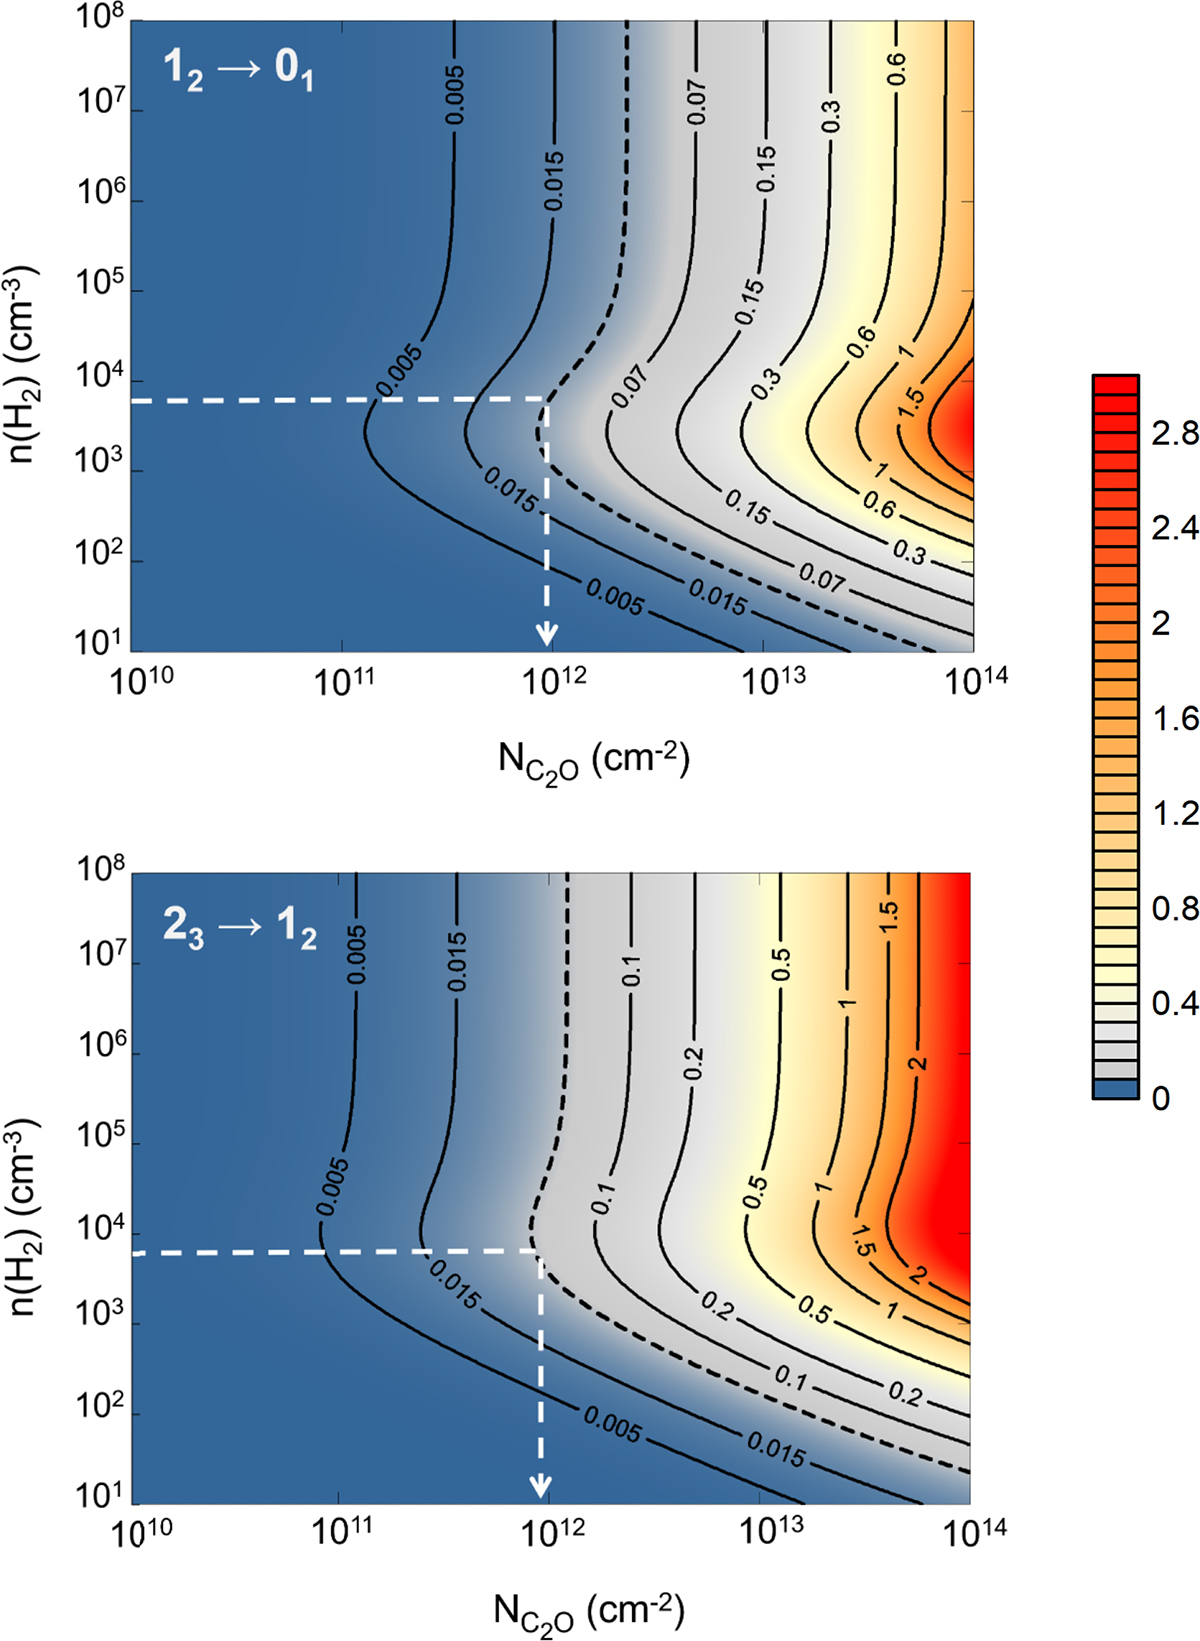
Fig. 6.
Download original image
Dependence of the 12→01 (top) and 23→12 (bottom) transition intensities (K) on column density (x axis) and n(H2) (y axis). With dashed black lines, we reproduce the isocurves of the intensities observed by Ohishi et al. (1991), and with dashed white lines the estimated column density (![]() cm−2) for n(H2) = 7·103 cm−3.
cm−2) for n(H2) = 7·103 cm−3.
Current usage metrics show cumulative count of Article Views (full-text article views including HTML views, PDF and ePub downloads, according to the available data) and Abstracts Views on Vision4Press platform.
Data correspond to usage on the plateform after 2015. The current usage metrics is available 48-96 hours after online publication and is updated daily on week days.
Initial download of the metrics may take a while.