Fig. 5
Download original image
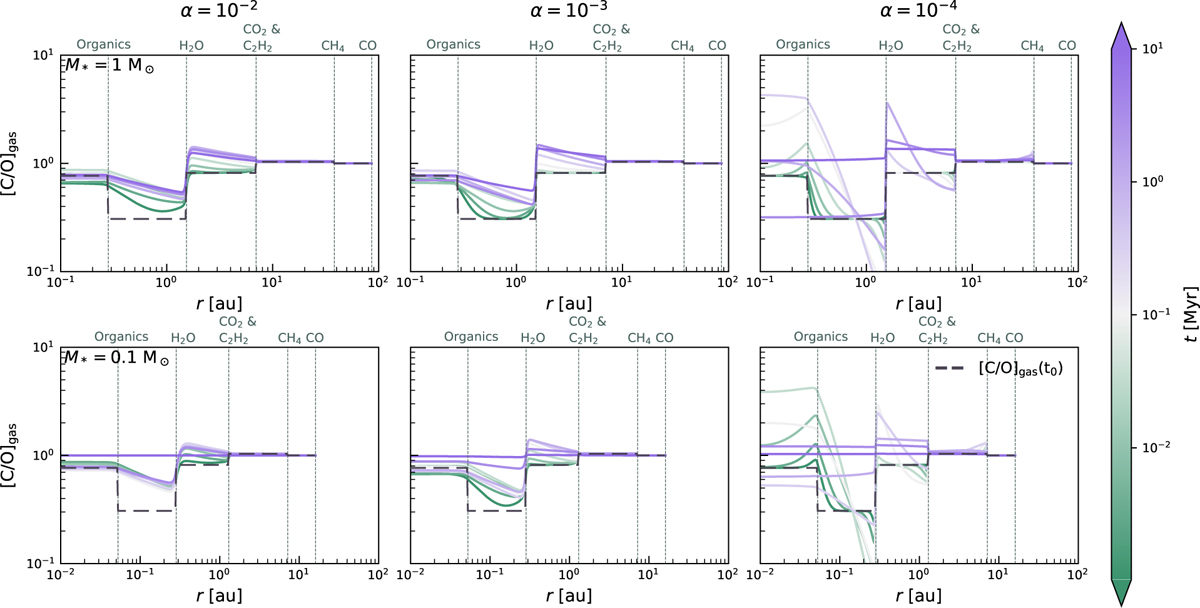
Gas-phase C/O ratio as a function of distance to the star for the two different values of the stellar mass (M∗ = 1, 0.1 M⊙) and three values of the turbulent viscosity (α = 10−2, 10−3, 10−4). The horizontal dashed grey line represents the initial C/O ratio. The sublimation lines of the main species contributing to the C/O ratio are indicated with vertical lines. We see that the evolution of the gas-phase C/O ratio does not change significantly with varying disc turbulence (α > 10−3) and stellar mass. However, in the α = 10−4 case, where the pebble flux is intense and diffusion is slow, the variations in gas-phase C/O ratio are greater. Once the pebble flux runs out, viscous flows govern the evolution of the gas-phase C/O ratio, leading to differences depending on stellar mass.
Current usage metrics show cumulative count of Article Views (full-text article views including HTML views, PDF and ePub downloads, according to the available data) and Abstracts Views on Vision4Press platform.
Data correspond to usage on the plateform after 2015. The current usage metrics is available 48-96 hours after online publication and is updated daily on week days.
Initial download of the metrics may take a while.