Fig. 3
Download original image
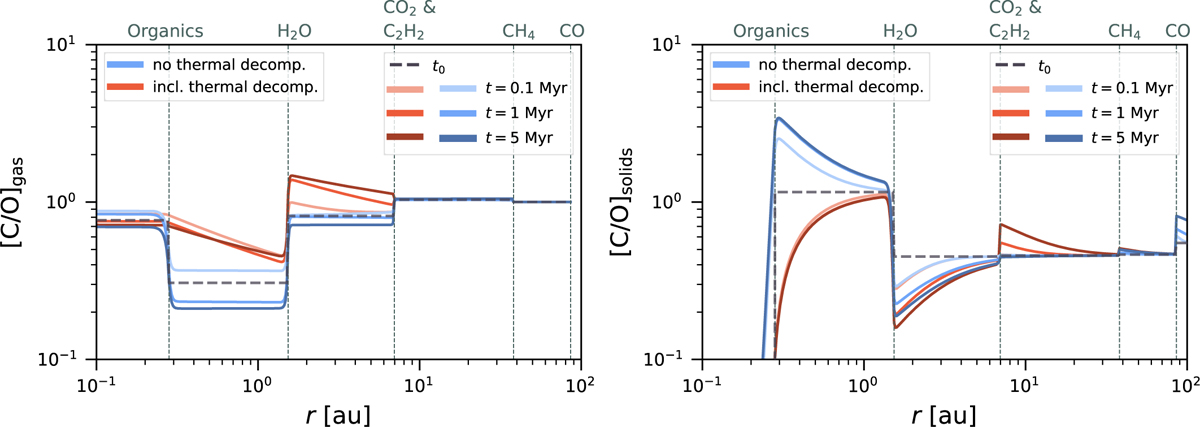
Gas-phase (left panel) and solid-phase (right panel) C/O ratios as functions of distance from a solar-mass star for a disc characterised by α = 10−3. Blue lines represent a standard model that excludes the thermal decomposition of refractory organics (e.g. Mah et al. 2023), while red lines show the results from our model, including that effect. The horizontal dashed grey line represents the initial C/O ratio. The sublimation lines of the main species contributing to the C/O ratio are indicated with vertical lines. From this plot, we see that the thermal decomposition of refractory organics significantly influences the gas-phase and solid-phase C/O ratio in the disc. The gas-phase C/O ratio is generally much higher when the thermal decomposition of refractory organics is included.
Current usage metrics show cumulative count of Article Views (full-text article views including HTML views, PDF and ePub downloads, according to the available data) and Abstracts Views on Vision4Press platform.
Data correspond to usage on the plateform after 2015. The current usage metrics is available 48-96 hours after online publication and is updated daily on week days.
Initial download of the metrics may take a while.