Fig. 1
Download original image
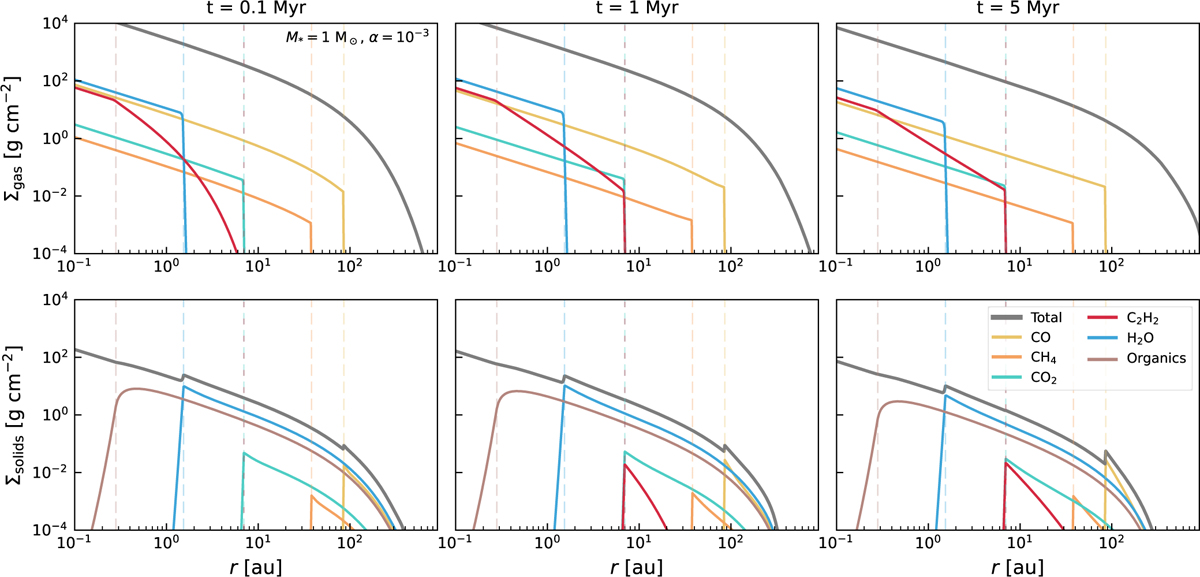
Gas surface density (top) and solid surface density (bottom) of the main chemical species that contribute to the C/O ratio at 0.1, 1, and 5 Myr. We ran this simulation with M∗ = 1 M⊙ and α = 10−3. The total (dust or gas) surface density is represented as a dark solid line in each row. Vertical dashed lines indicate the sublimation lines of the displayed species in their respective colour, using Tsub,CO = 20 K, Tsub,CH4 = 30 K, Tsub,CO2 = 70 K, Tsub,C2H2 = 70 K, Tsub,H2O = 150 K, and Tsub,refractory = 350 K (see Table A.1).
Current usage metrics show cumulative count of Article Views (full-text article views including HTML views, PDF and ePub downloads, according to the available data) and Abstracts Views on Vision4Press platform.
Data correspond to usage on the plateform after 2015. The current usage metrics is available 48-96 hours after online publication and is updated daily on week days.
Initial download of the metrics may take a while.