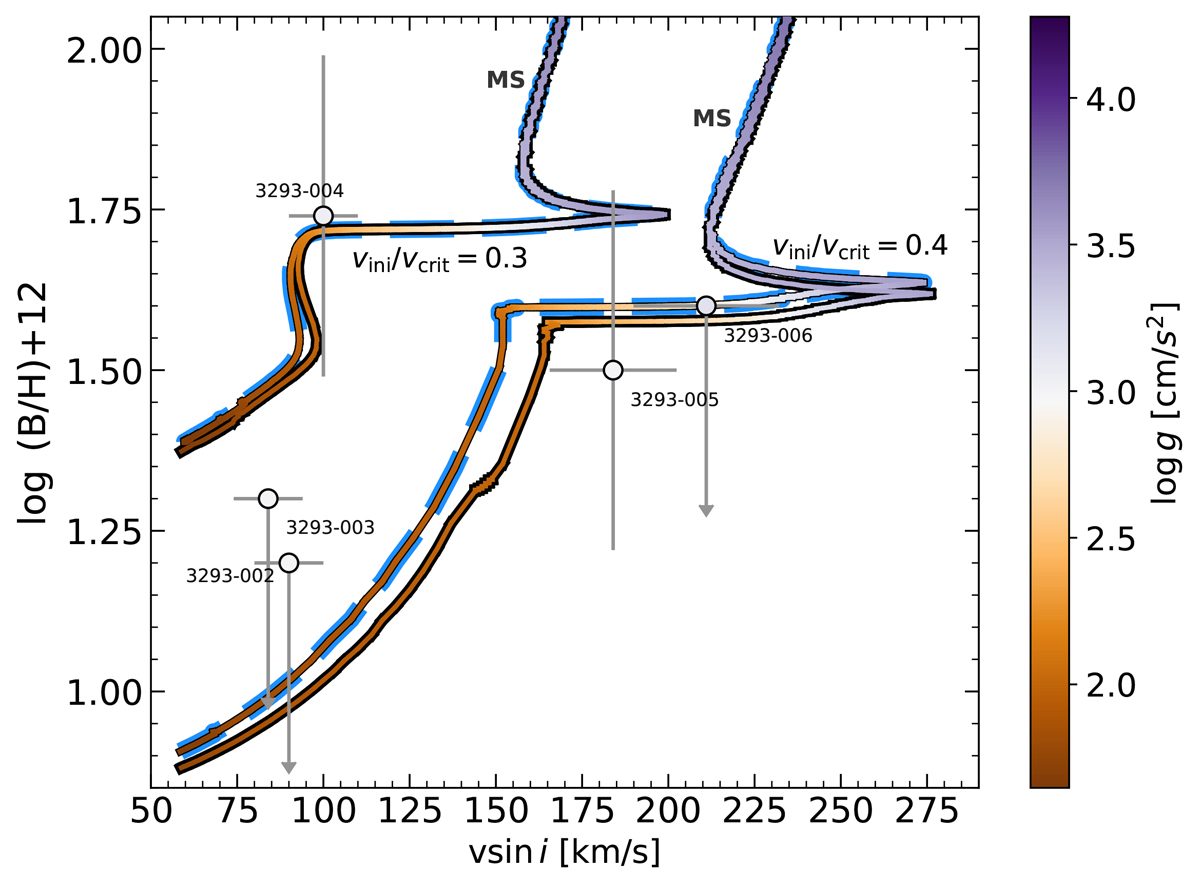
Fig. C.1.
Download original image
Post-MS evolution of the magnetic 15 M⊙ models with vini/vcrit = 0.3, 0.4. The models with the dashed blue outlines have been computed with Spruit (2002)’s prescription, while the models with the thick black outline have been computed with the calibrated prescription of Eggenberger et al. (2022). We note that the colouring scheme applies to both the models and the datapoints (i.e., the observed stars have log g ≈ 3).
Current usage metrics show cumulative count of Article Views (full-text article views including HTML views, PDF and ePub downloads, according to the available data) and Abstracts Views on Vision4Press platform.
Data correspond to usage on the plateform after 2015. The current usage metrics is available 48-96 hours after online publication and is updated daily on week days.
Initial download of the metrics may take a while.