Fig. 9
Download original image
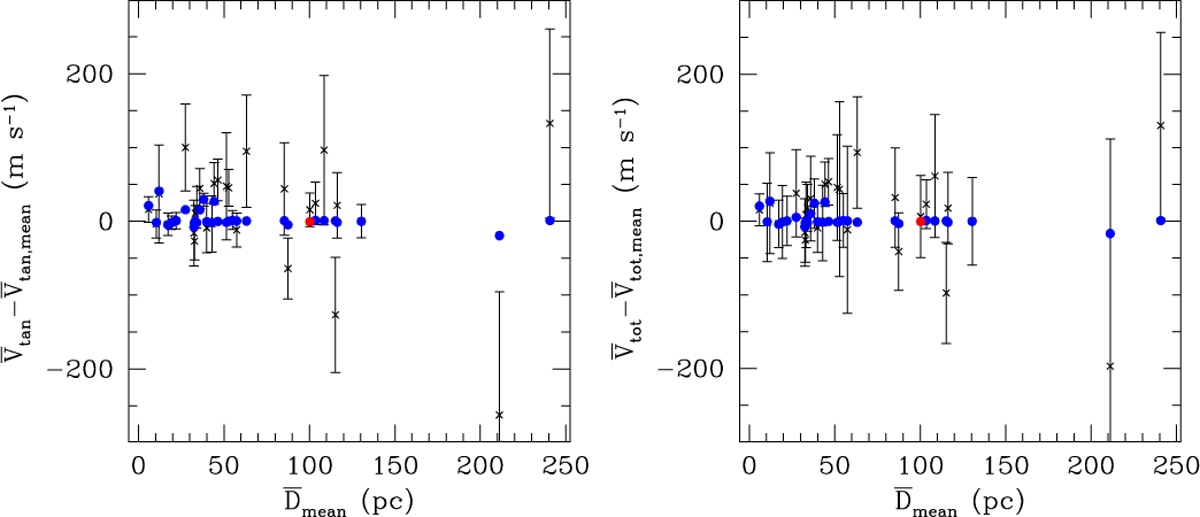
Influence of velocity distance scaling. The blue and red points show the differences between the best fitting Vtan (left) and Vtot (right) and Vtan,mean and Vtot,mean (computed by scaling the proper motions with the mean Gaia distances Dmean) as a function of Dmean. The crosses show the differences between Vtan and Vtot (computed by scaling the proper motions with the Gaia distances of each star separately) and Vtan,mean and Vtot,mean. No systematic trends with distances are observed.
Current usage metrics show cumulative count of Article Views (full-text article views including HTML views, PDF and ePub downloads, according to the available data) and Abstracts Views on Vision4Press platform.
Data correspond to usage on the plateform after 2015. The current usage metrics is available 48-96 hours after online publication and is updated daily on week days.
Initial download of the metrics may take a while.