Fig. 7

Download original image
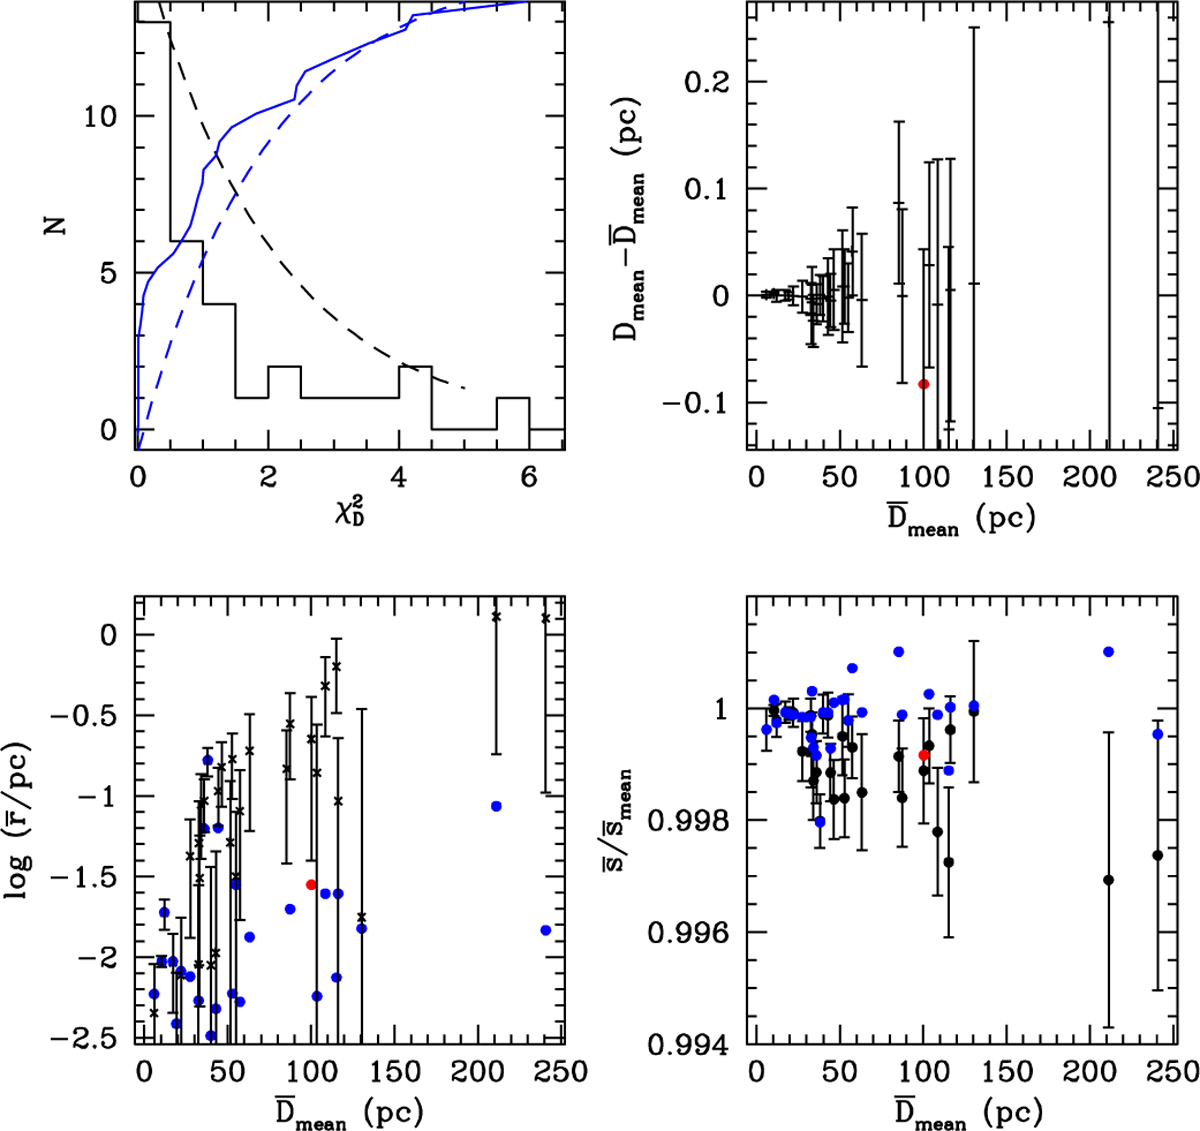
Distances and separations of the WB sample. Top left: the histogram of ![]() values (black full line). The blue line shows the cumulative distribution of
values (black full line). The blue line shows the cumulative distribution of ![]() , the dashed black and blue lines show the χ2 distribution and its cumulative for 2 degrees of freedom. Top right: the difference
, the dashed black and blue lines show the χ2 distribution and its cumulative for 2 degrees of freedom. Top right: the difference ![]() as a function of
as a function of ![]() . The difference is zero within the errors. Bottom left: crosses show r̄ (the WB separations estimated using Gaia distances and Eq. (15)) as a function of the mean WB distance
. The difference is zero within the errors. Bottom left: crosses show r̄ (the WB separations estimated using Gaia distances and Eq. (15)) as a function of the mean WB distance ![]() . The blue and red points show r, the best fitting WB separations. The largest r̄ are observed at the largest distances. They overestimate r by an order of magnitude or more. Bottom right: the ratio
. The blue and red points show r, the best fitting WB separations. The largest r̄ are observed at the largest distances. They overestimate r by an order of magnitude or more. Bottom right: the ratio ![]() as a function of Dmean. The blue and red points show
as a function of Dmean. The blue and red points show ![]() . The WB separation on the sky
. The WB separation on the sky ![]() (estimated by scaling the angular separation θ with the mean WB distance), increasingly overestimates s (obtained by scaling θ with the minimal Gaia distance), as the distance to the WB increases. The best fitting distances deliver
(estimated by scaling the angular separation θ with the mean WB distance), increasingly overestimates s (obtained by scaling θ with the minimal Gaia distance), as the distance to the WB increases. The best fitting distances deliver ![]() .
.
Current usage metrics show cumulative count of Article Views (full-text article views including HTML views, PDF and ePub downloads, according to the available data) and Abstracts Views on Vision4Press platform.
Data correspond to usage on the plateform after 2015. The current usage metrics is available 48-96 hours after online publication and is updated daily on week days.
Initial download of the metrics may take a while.


