Fig. 4
Download original image
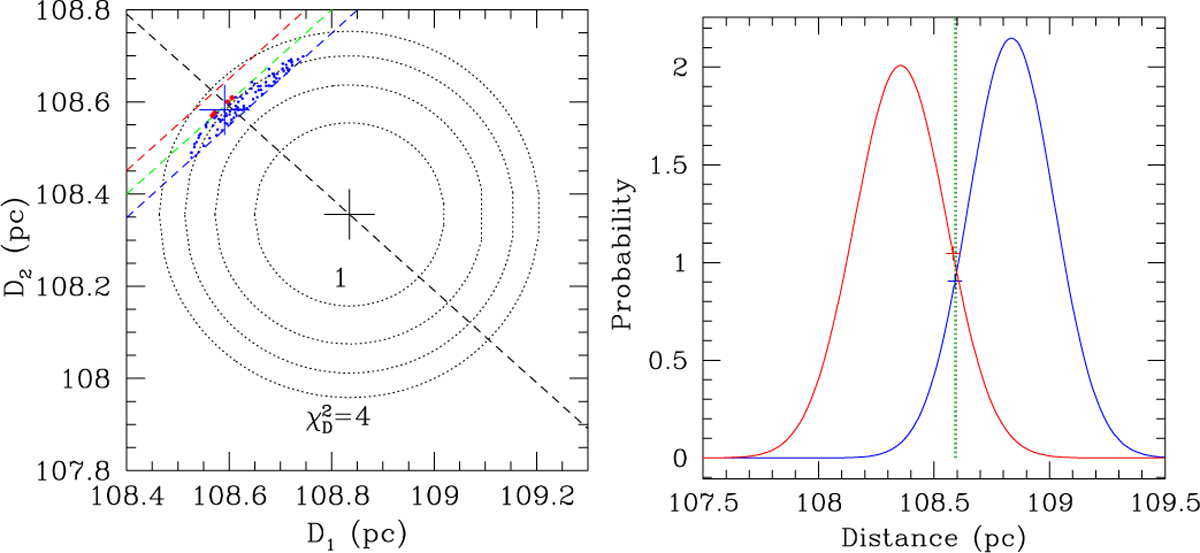
Distances of the binary HD 4552,BD+120090. Left: contours of ![]() (dotted lines) in the D1, D2 plane. The black and blue crosses show the Gaia and best-fitting distances, respectively. The dashed black line shows
(dotted lines) in the D1, D2 plane. The black and blue crosses show the Gaia and best-fitting distances, respectively. The dashed black line shows ![]() ; the green line shows D1 = D2. The blue and red dashed lines show distances delivering r = 2GM/Vtot2. The blue and red dots show the first 100 D1 and D2 distances (ranked by
; the green line shows D1 = D2. The blue and red dashed lines show distances delivering r = 2GM/Vtot2. The blue and red dots show the first 100 D1 and D2 distances (ranked by ![]() ) with vmax/Vtot ≤ 1. Right: probability distributions of the distances of HD 4552 (blue) and BD+120090 (red). The crosses show the best-fitting Newtonian solution. The dotted black and green lines show
) with vmax/Vtot ≤ 1. Right: probability distributions of the distances of HD 4552 (blue) and BD+120090 (red). The crosses show the best-fitting Newtonian solution. The dotted black and green lines show ![]() , respectively.
, respectively.
Current usage metrics show cumulative count of Article Views (full-text article views including HTML views, PDF and ePub downloads, according to the available data) and Abstracts Views on Vision4Press platform.
Data correspond to usage on the plateform after 2015. The current usage metrics is available 48-96 hours after online publication and is updated daily on week days.
Initial download of the metrics may take a while.