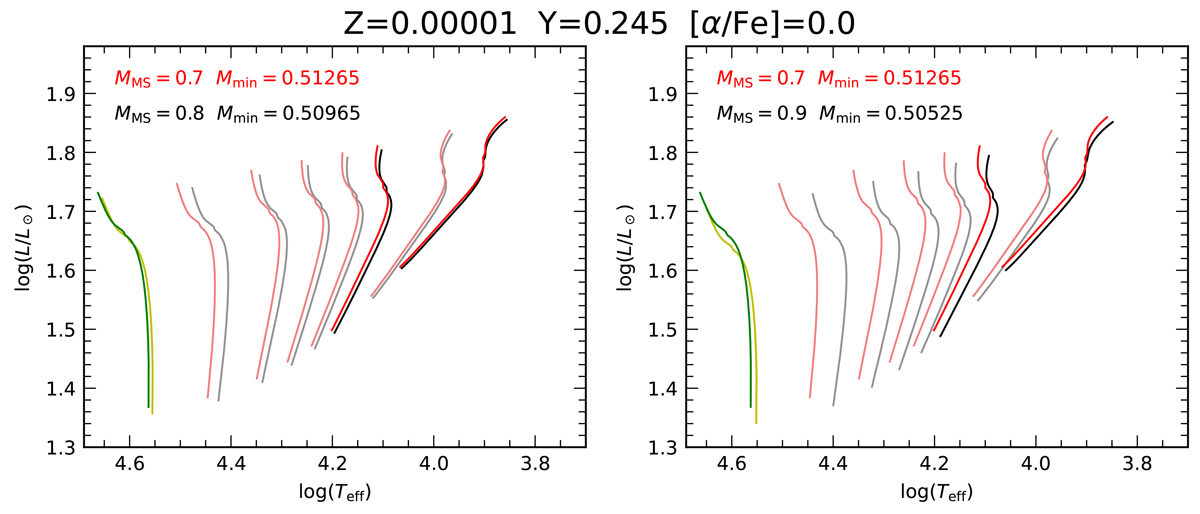
Fig. 2.
Download original image
Comparison between HB evolutionary tracks for Z = 0.000010, Y = 0.245, and [α/Fe] = 0.00 with MMS = 0.700 M⊙ and: (i) MMS = 0.800 M⊙ (left panel), and (ii) MMS = 0.900 M⊙ (right panel). In each panel, green and yellow lines correspond to the Mmin value reached for MMS = 0.700 M⊙ and the alternative MMS value shown in the plot, respectively. Red and black lines correspond to masses in steps of ΔM = 0.010 M⊙ for MMS = 0.700 M⊙ and the alternative MMS values, respectively. In like vein, red and gray lines correspond to evolutionary tracks for MMS = 0.700 M⊙ and the alternative MMS values, respectively, with masses of MHB = 0.650 M⊙, 0.580 M⊙, 0.560 M⊙, 0.540 M⊙, 0.520 M⊙, and in steps of ΔM = 0.010 M⊙ for sets with evolutionary tracks that reach masses lower than 0.500 M⊙.
Current usage metrics show cumulative count of Article Views (full-text article views including HTML views, PDF and ePub downloads, according to the available data) and Abstracts Views on Vision4Press platform.
Data correspond to usage on the plateform after 2015. The current usage metrics is available 48-96 hours after online publication and is updated daily on week days.
Initial download of the metrics may take a while.