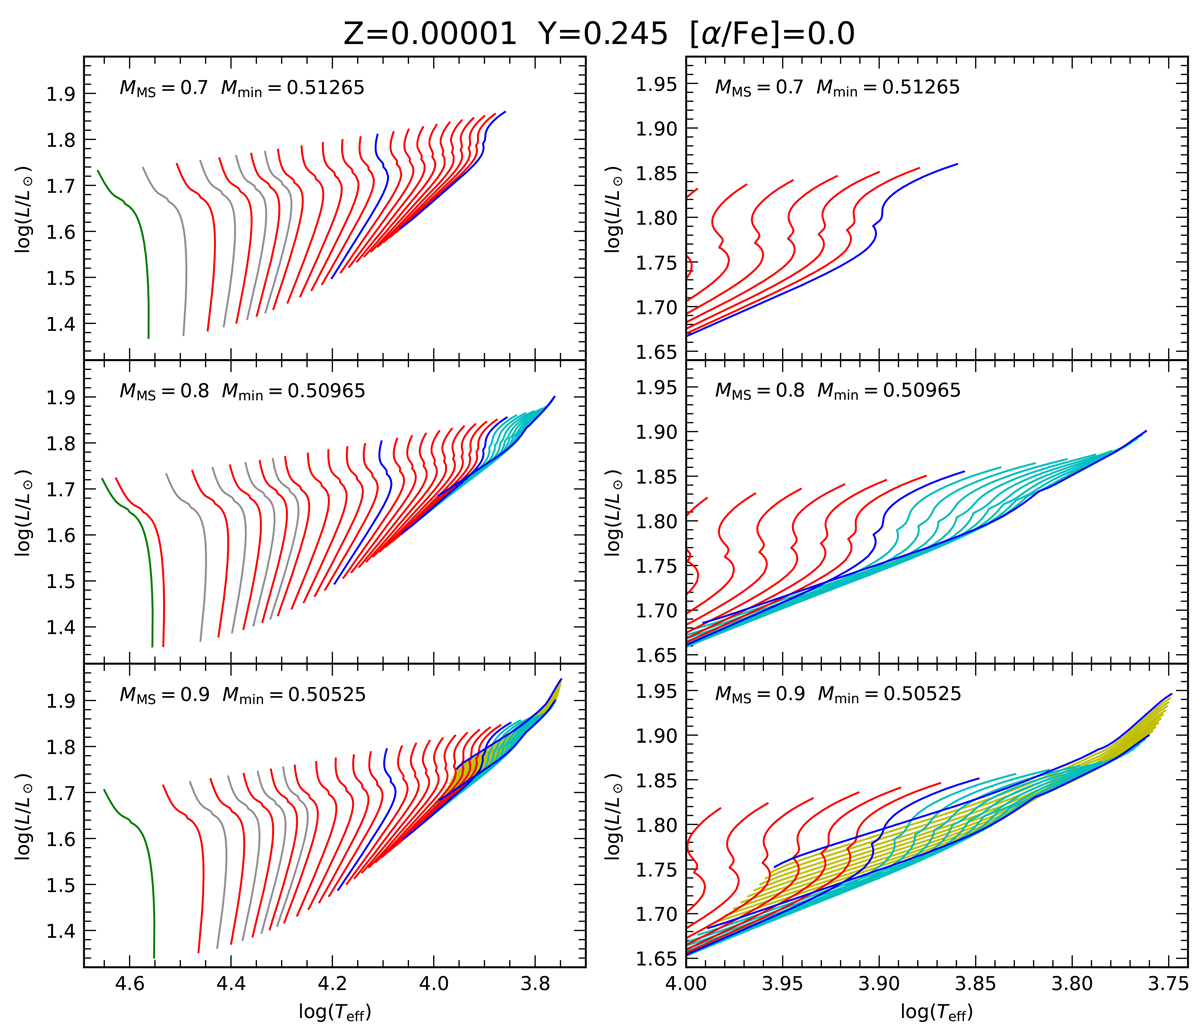
Fig. 1.
Download original image
HB evolutionary tracks in the theoretical plane – luminosity, log(L/L⊙), vs. effective temperature, log Teff – for Z = 0.00001, Y = 0.245, and [α/Fe] = 0.00. The top, middle, and bottom left panels show the set of evolutionary tracks corresponding to progenitor masses of MMS = 0.700 M⊙, 0.800 M⊙, and 0.900 M⊙, respectively. The right panels are a zoom-in around the cooler part of the HB. Each panel also shows the minimum mass, Mmin, reached for each set (green lines), corresponding to the hottest track. Blue, red, and gray lines correspond to evolutionary tracks in steps of ΔM = 0.100 M⊙, ΔM = 0.010 M⊙ (for masses lower than 0.700 M⊙), and ΔM = 0.005 M⊙ (for masses lower than 0.550 M⊙), respectively. Cyan lines correspond to evolutionary tracks computed with masses greater than 0.700 M⊙ and lower than 0.800 M⊙, in steps of ΔM = 0.010 M⊙. Yellow lines correspond to evolutionary tracks for masses greater than 0.800 M⊙ and lower than 0.900 M⊙, in steps of ΔM = 0.010 M⊙.
Current usage metrics show cumulative count of Article Views (full-text article views including HTML views, PDF and ePub downloads, according to the available data) and Abstracts Views on Vision4Press platform.
Data correspond to usage on the plateform after 2015. The current usage metrics is available 48-96 hours after online publication and is updated daily on week days.
Initial download of the metrics may take a while.