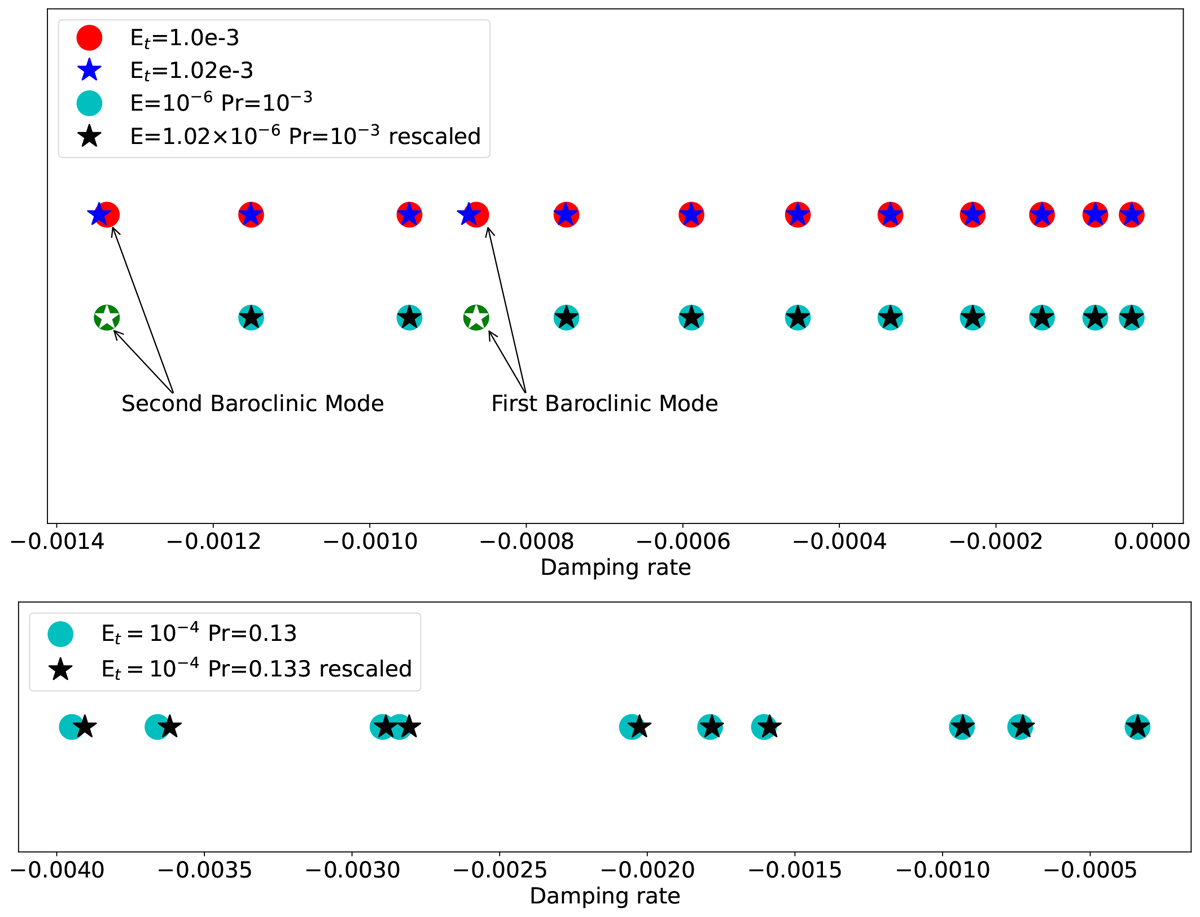
Fig. 10.
Download original image
Distribution of eigenvalues along the real axis. Top panel: Results for constant viscosity (top line) or constant Prandtl number (bottom line). Eigenvalues are computed with parameters n = 3, Q = 1, Ω = 0.15, η = 0.18, Lmax = 100, and Nr = 50 using the QZ-algorithm. Parameters E and Et are given in the legend. Bottom panel: Same as above, but with constant heat diffusion and varying viscosity. Eigenvalues have been rescaled by the ratio of viscosities.
Current usage metrics show cumulative count of Article Views (full-text article views including HTML views, PDF and ePub downloads, according to the available data) and Abstracts Views on Vision4Press platform.
Data correspond to usage on the plateform after 2015. The current usage metrics is available 48-96 hours after online publication and is updated daily on week days.
Initial download of the metrics may take a while.