Fig. 1.
Download original image
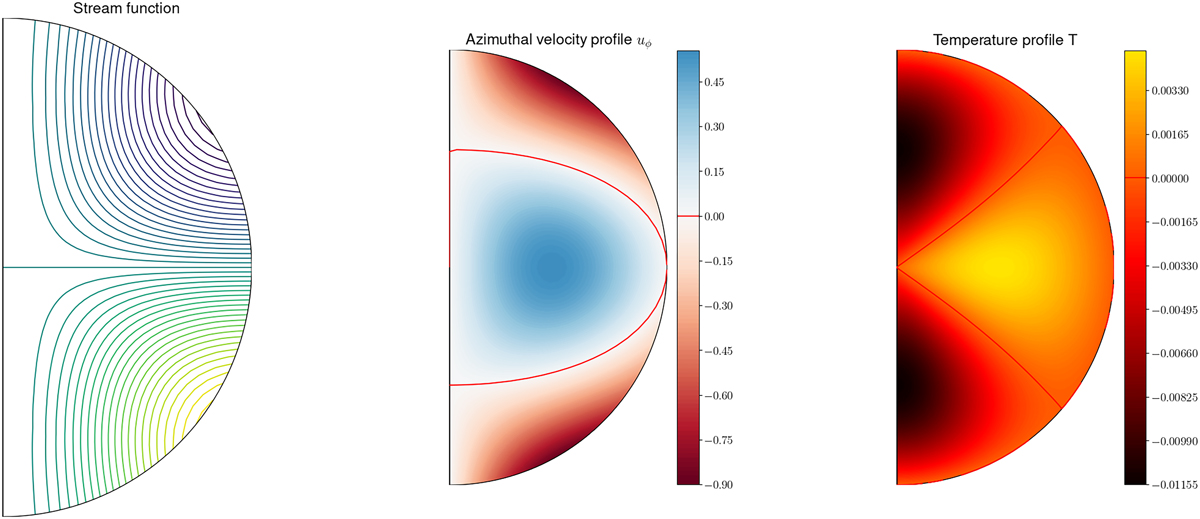
Meridional view of the least-damped baroclinic mode. Left: streamlines of the meridional velocity; middle: azimuthal velocity; right: temperature perturbation. In the middle and right panels, solid lines indicate the change of sign of the field. The solution is associated with the eigenvalue λ=−8.653×10⁻³ obtained with parameters E = 0, Et = 10−3, N = 1, and numerical resolution Lmax = 50, Nr = 50.
Current usage metrics show cumulative count of Article Views (full-text article views including HTML views, PDF and ePub downloads, according to the available data) and Abstracts Views on Vision4Press platform.
Data correspond to usage on the plateform after 2015. The current usage metrics is available 48-96 hours after online publication and is updated daily on week days.
Initial download of the metrics may take a while.