Fig. 7.
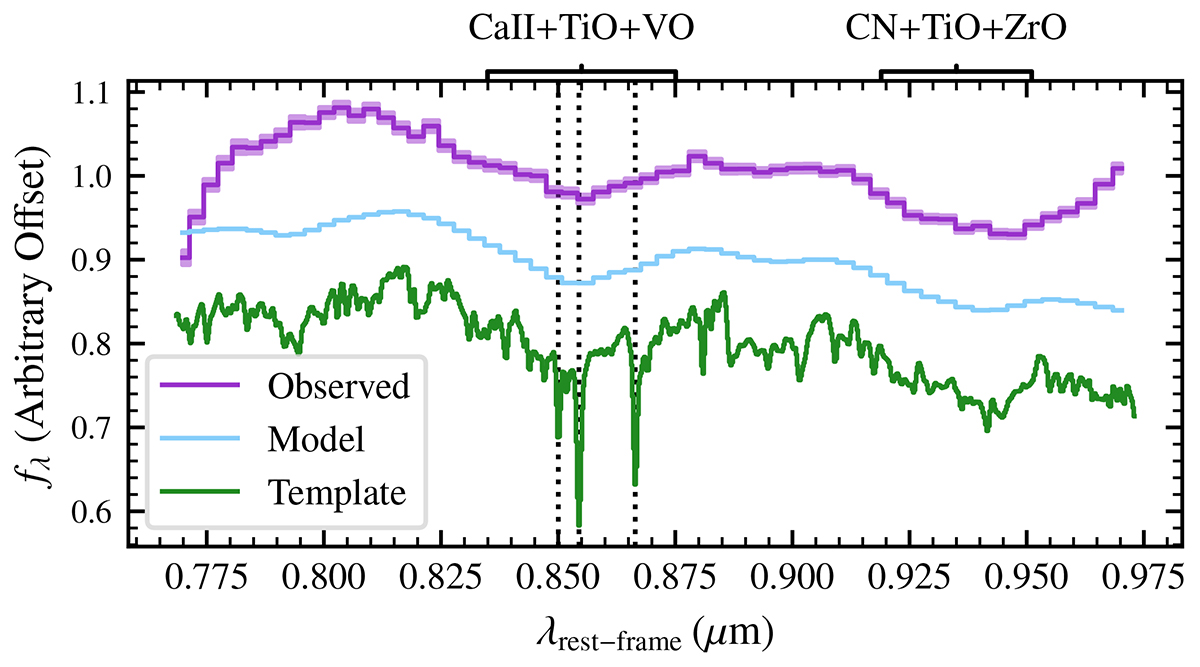
Download original image
Example of the rest-frame absorption features visible in a number of the passive cluster members. At the top, we display the observed 1D spectrum for galaxy ID 3528 in the F115W filter, after de-redshifting the spectrum. At the bottom we show the best-fit template spectrum at the native template resolution, and in the middle the best-fit template after forward-modelling the NIRISS spectral resolution and the morphological broadening effect of this particular galaxy. The dotted lines indicate the Ca II triplet, and we annotate at the top the approximate area covered by the molecular absorption bands. The fall-off and upturn at the blue and red outer edges of the observed 1D spectrum are merely an artefact of the Horne (1986) 1D extraction algorithm for extended sources (see also Fig. D.1c). This does not affect the redshift fit, which is performed on the original 2D spectra.
Current usage metrics show cumulative count of Article Views (full-text article views including HTML views, PDF and ePub downloads, according to the available data) and Abstracts Views on Vision4Press platform.
Data correspond to usage on the plateform after 2015. The current usage metrics is available 48-96 hours after online publication and is updated daily on week days.
Initial download of the metrics may take a while.