Fig. 5.
Download original image
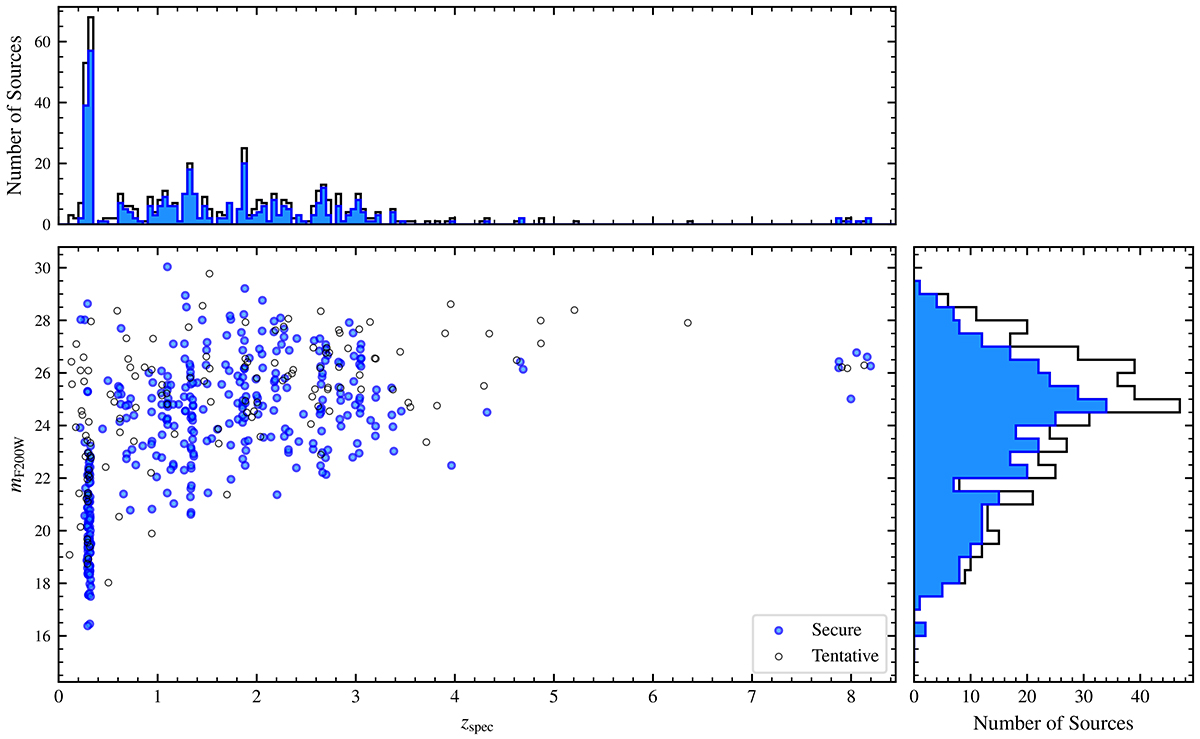
Centre: AB magnitude distribution of all sources (measured in the F200W filter), against the spectroscopic redshift measured from NIRISS. We distinguish between ‘secure’ redshifts, shown as solid blue circles, and ‘tentative’ redshifts, plotted as empty black circles. Upper: Corresponding stacked redshift histogram, showing the number of sources in each bin of width 0.05. Here, tentative redshifts are displayed as an unfilled histogram. Right: As before, showing the distribution of source magnitudes in bins of width 0.5 dex.
Current usage metrics show cumulative count of Article Views (full-text article views including HTML views, PDF and ePub downloads, according to the available data) and Abstracts Views on Vision4Press platform.
Data correspond to usage on the plateform after 2015. The current usage metrics is available 48-96 hours after online publication and is updated daily on week days.
Initial download of the metrics may take a while.