Fig. 3.
Download original image
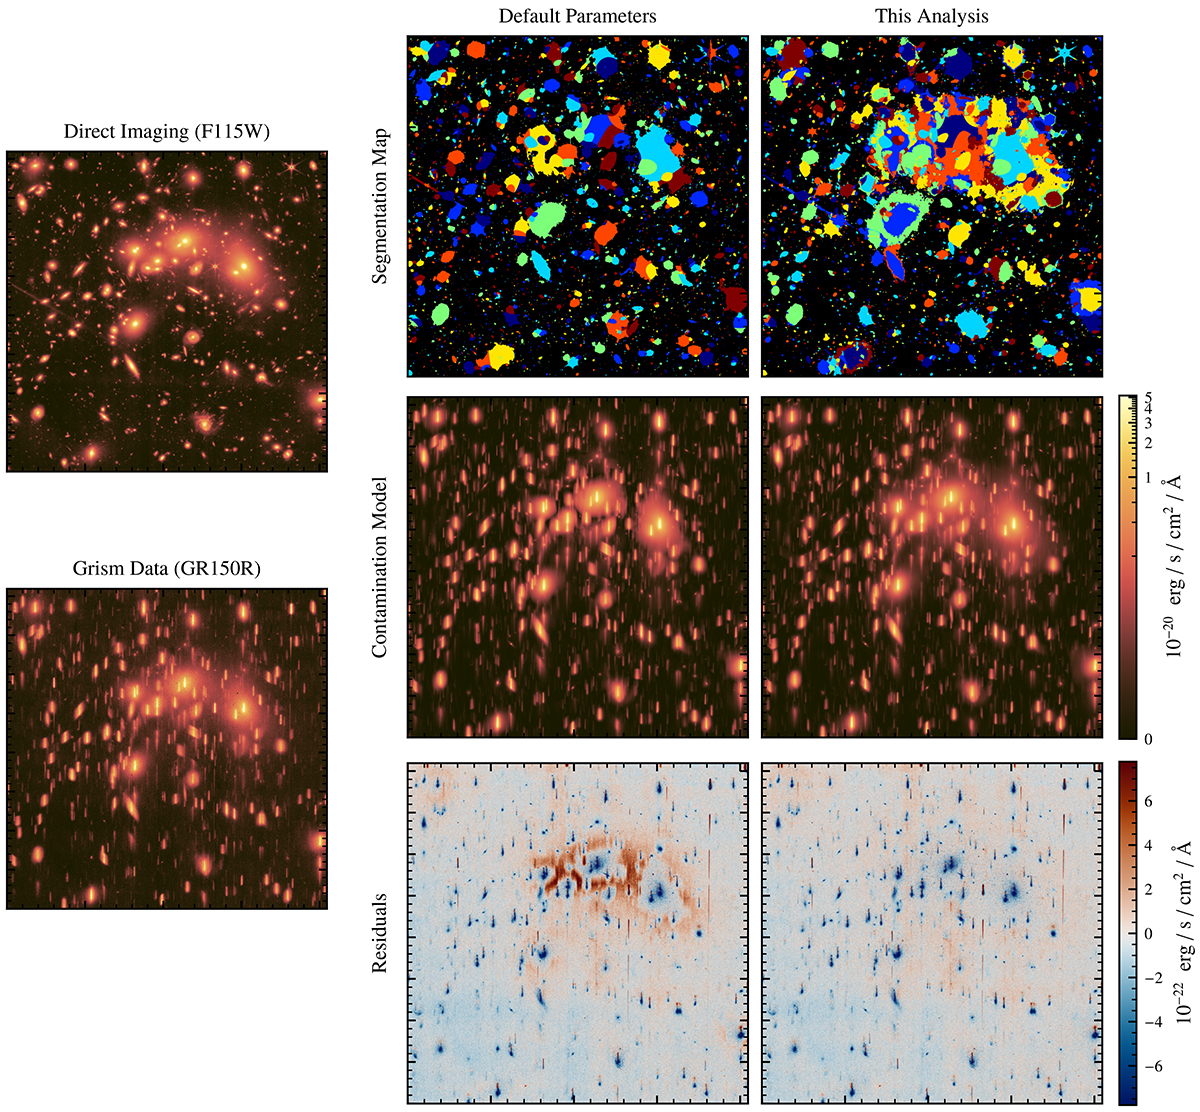
Left: Examples of the observed data, specifically the drizzled direct imaging in the F115W blocking filter and the corresponding dispersed spectra using the GR150R grism. The colour map for these plots uses a logarithmic scale, with the colour bar shown on the right. Top right: Derived segmentation map for both the default GRIZLI parameters (left) and the parameters used in this analysis (right), following all inspection and additional de-blending steps. Middle right: Contamination model derived using each of the segmentation maps. Note that the default reduction pipeline isolates many of the extended galaxies from the diffuse cluster light. Bottom-right: Residual flux after subtracting each contamination model from the observations. The colour map here adopts a linear scale and covers a much narrower range.
Current usage metrics show cumulative count of Article Views (full-text article views including HTML views, PDF and ePub downloads, according to the available data) and Abstracts Views on Vision4Press platform.
Data correspond to usage on the plateform after 2015. The current usage metrics is available 48-96 hours after online publication and is updated daily on week days.
Initial download of the metrics may take a while.