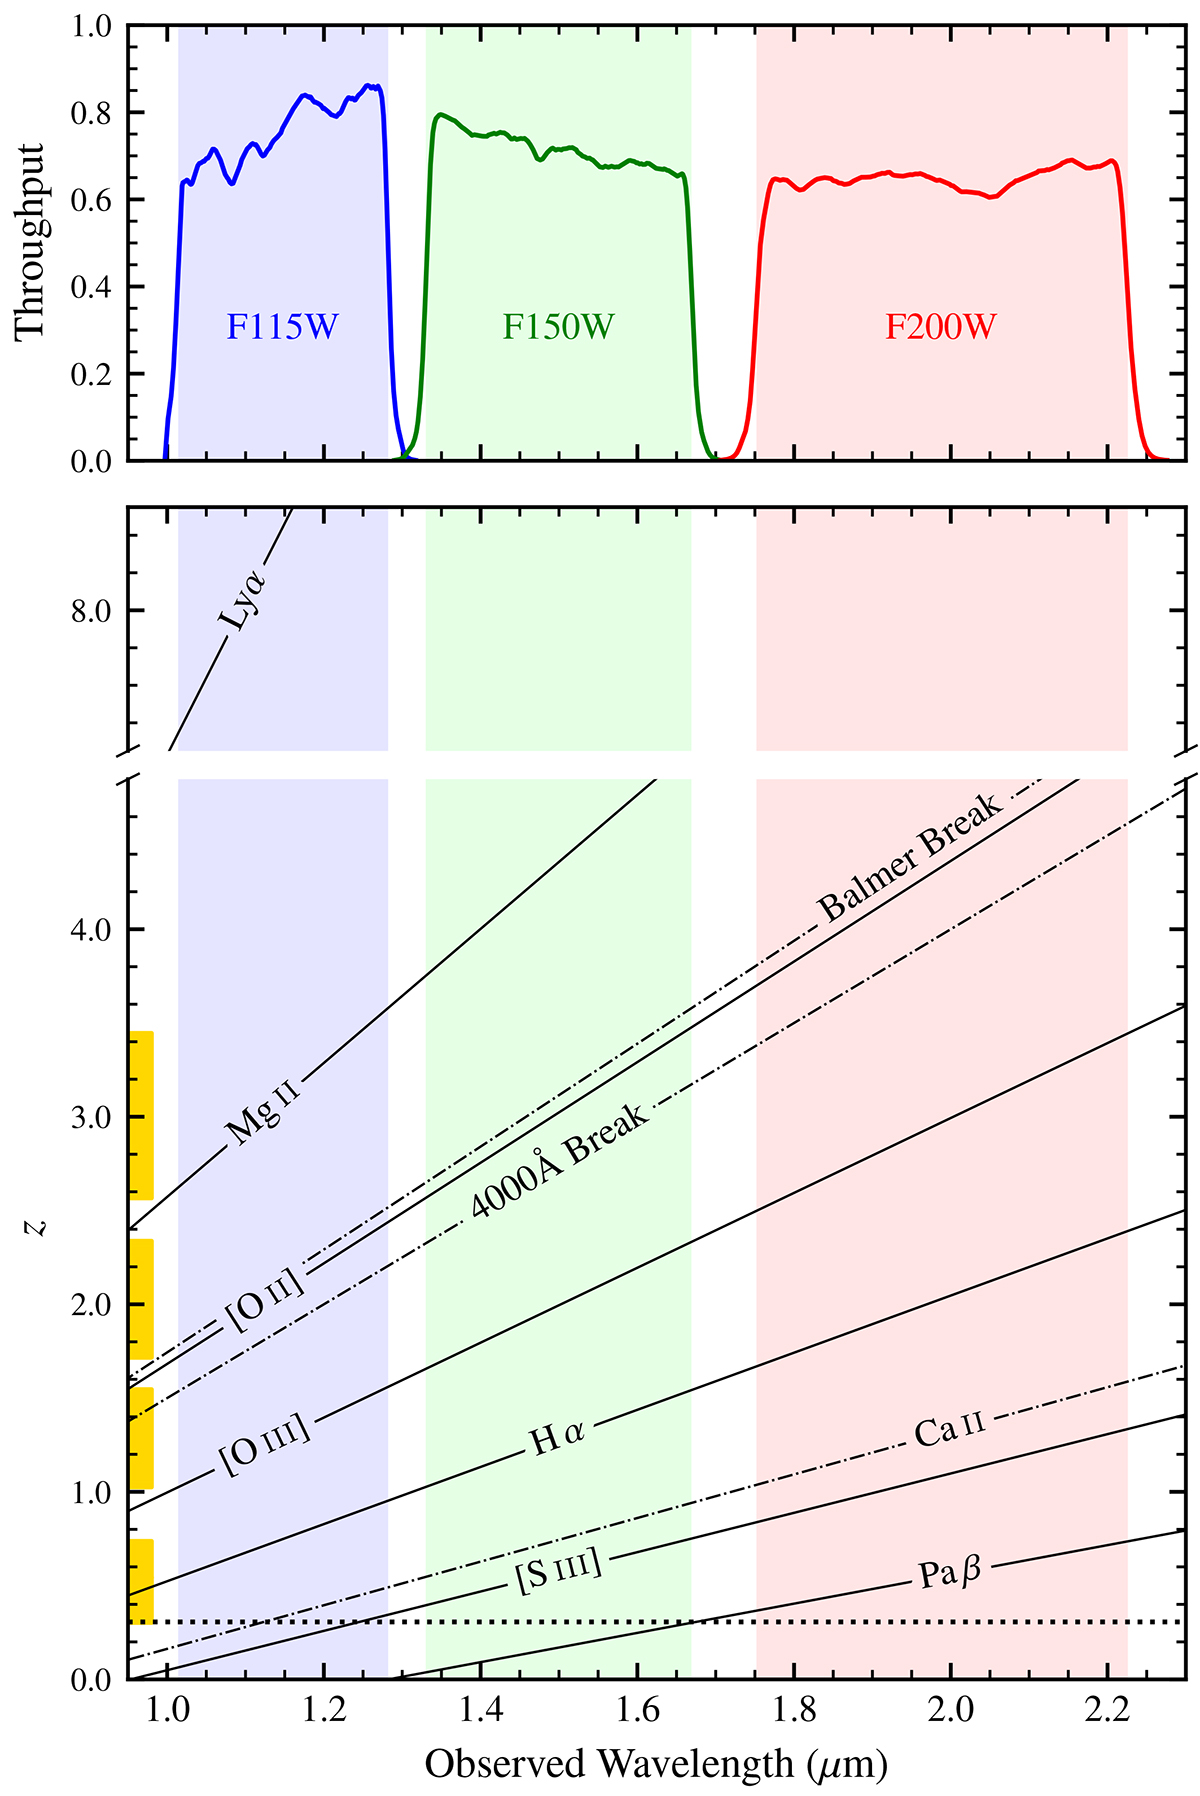
Fig. 2.
Download original image
Top: Throughput of the three broad-band NIRISS filters used in this analysis: F115W, F150W, and F200W. The shaded regions correspond to the wavelength range within which the throughput is greater than 50% of the peak value. Bottom: Visibility of a selection of strong optical-NIR emission lines (solid lines) and absorption features (dot-dashed lines), varying with redshift. On the left of the plot, we show the approximate redshift ranges in which multiple strong lines are visible. The cluster redshift (z = 0.3064) is denoted by the dashed line.
Current usage metrics show cumulative count of Article Views (full-text article views including HTML views, PDF and ePub downloads, according to the available data) and Abstracts Views on Vision4Press platform.
Data correspond to usage on the plateform after 2015. The current usage metrics is available 48-96 hours after online publication and is updated daily on week days.
Initial download of the metrics may take a while.