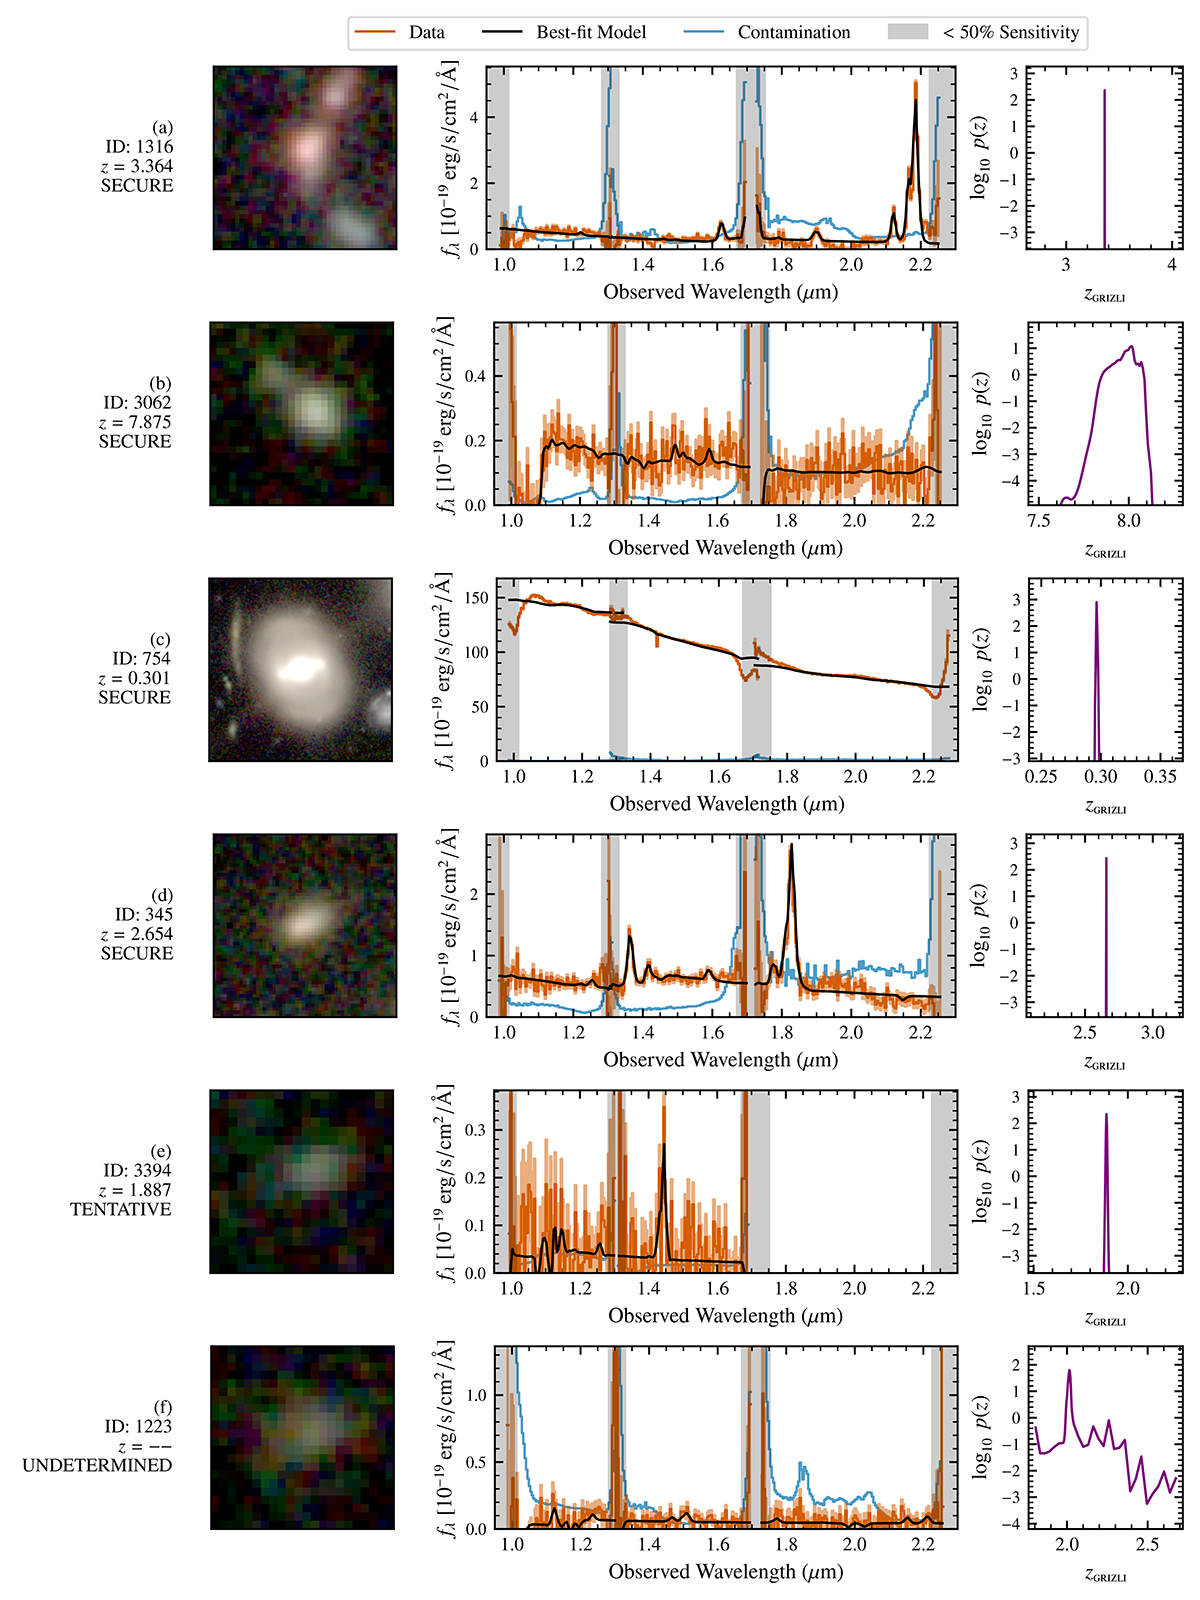
Fig. D.1.
Download original image
Examples of the various redshift quality flags. Left: RGB cut-outs of each object, created in the same manner as in Fig. 11. Centre: Extracted 1D spectra, with the same colour scheme as in Fig. 4. We also overlay the best-fit model spectrum for each source as a black line. Right: Redshift grid search, showing the (logarithmic) probability distribution as a function of redshift
Current usage metrics show cumulative count of Article Views (full-text article views including HTML views, PDF and ePub downloads, according to the available data) and Abstracts Views on Vision4Press platform.
Data correspond to usage on the plateform after 2015. The current usage metrics is available 48-96 hours after online publication and is updated daily on week days.
Initial download of the metrics may take a while.