Fig. A.1.
Download original image
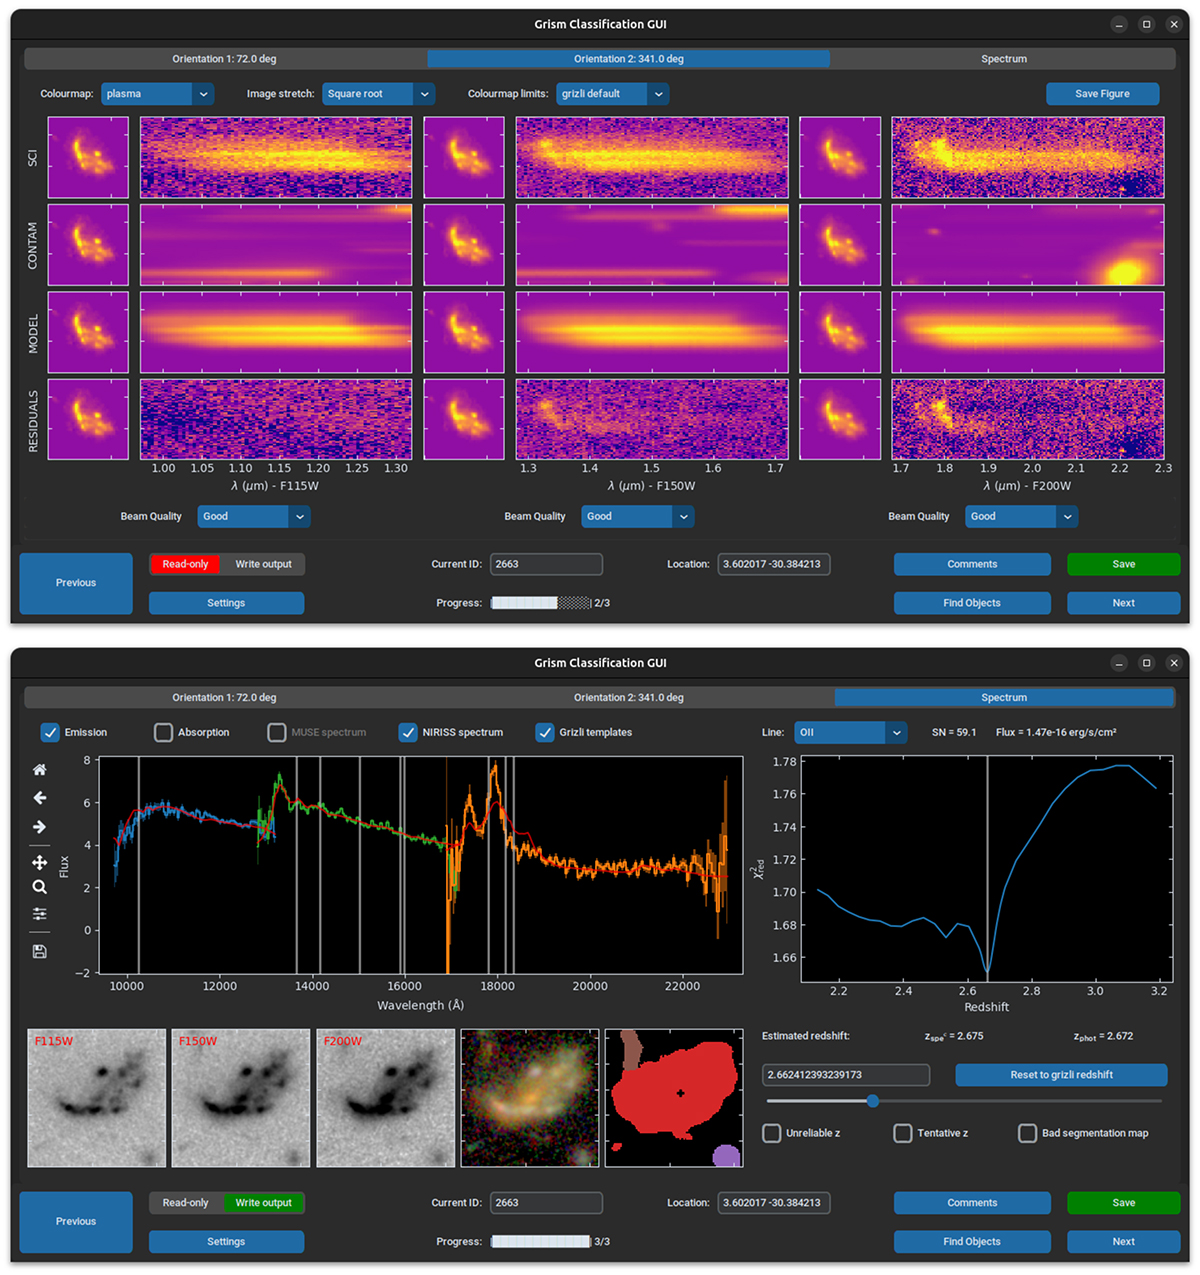
Top: Overview of one of the PYGCG tabs, displaying the stacked beams for a single position angle. From top to bottom, we show the dispersed 2D ‘science’ spectrum for the object of interest, the contaminating flux from nearby objects already subtracted from the science spectrum, the continuum model from the best-fitting combination of templates, and the residuals from subtracting the continuum model from the science spectrum. This lower row should reveal any emission lines if present, as evident here in the F150W and F200W filters. Bottom: Equivalent tab for the extracted 1D spectrum, showing also the direct image cut-outs (if available), a composite RGB image, and the segmentation map (where the object of interest is always coloured in red). Whilst more compact galaxies often have consistent 1D and 2D spectra, this is not always the case for extended objects. As shown here, spatially offset emission can result in misleading wavelength solutions in the extracted 1D spectrum. The plot of χ2 against redshift on the right-hand panel reveals that this is merely an artefact of the extraction algorithm, and the returned zGRIZLI is the most probable redshift solution.
Current usage metrics show cumulative count of Article Views (full-text article views including HTML views, PDF and ePub downloads, according to the available data) and Abstracts Views on Vision4Press platform.
Data correspond to usage on the plateform after 2015. The current usage metrics is available 48-96 hours after online publication and is updated daily on week days.
Initial download of the metrics may take a while.