Open Access
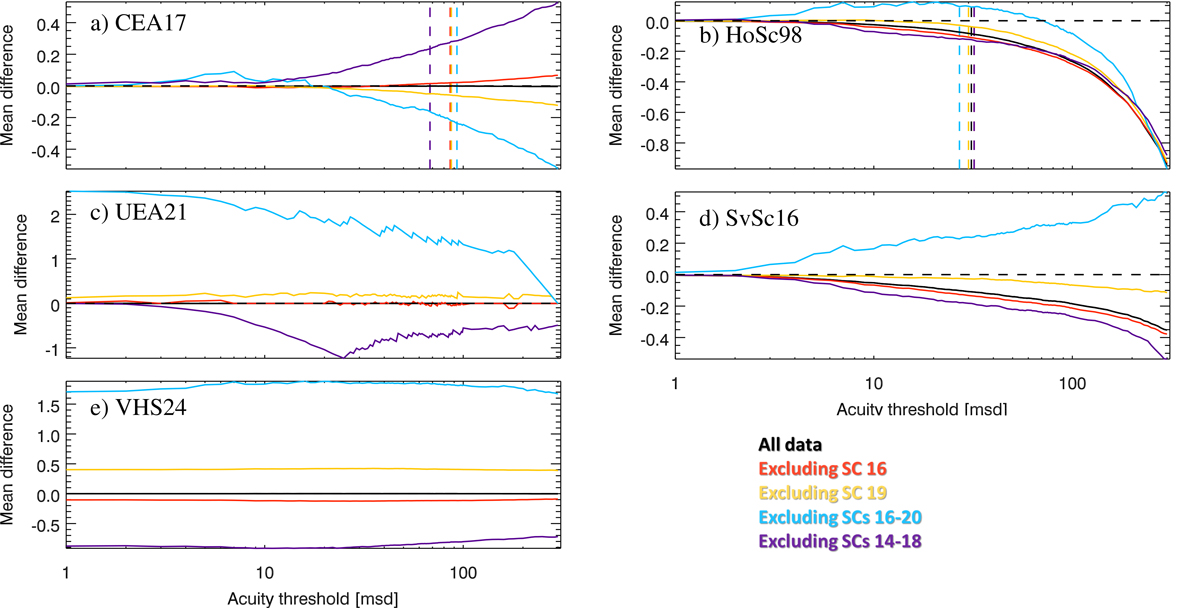
Fig. 9.
Download original image
Comparison of mean differences of calibrated to original RGO data for the various methods by considering different calibration periods. The vertical dashed lines indicate the acuity threshold beyond which the respective method excludes the observer based on its quality criteria (see Sect. 2.2).
Current usage metrics show cumulative count of Article Views (full-text article views including HTML views, PDF and ePub downloads, according to the available data) and Abstracts Views on Vision4Press platform.
Data correspond to usage on the plateform after 2015. The current usage metrics is available 48-96 hours after online publication and is updated daily on week days.
Initial download of the metrics may take a while.