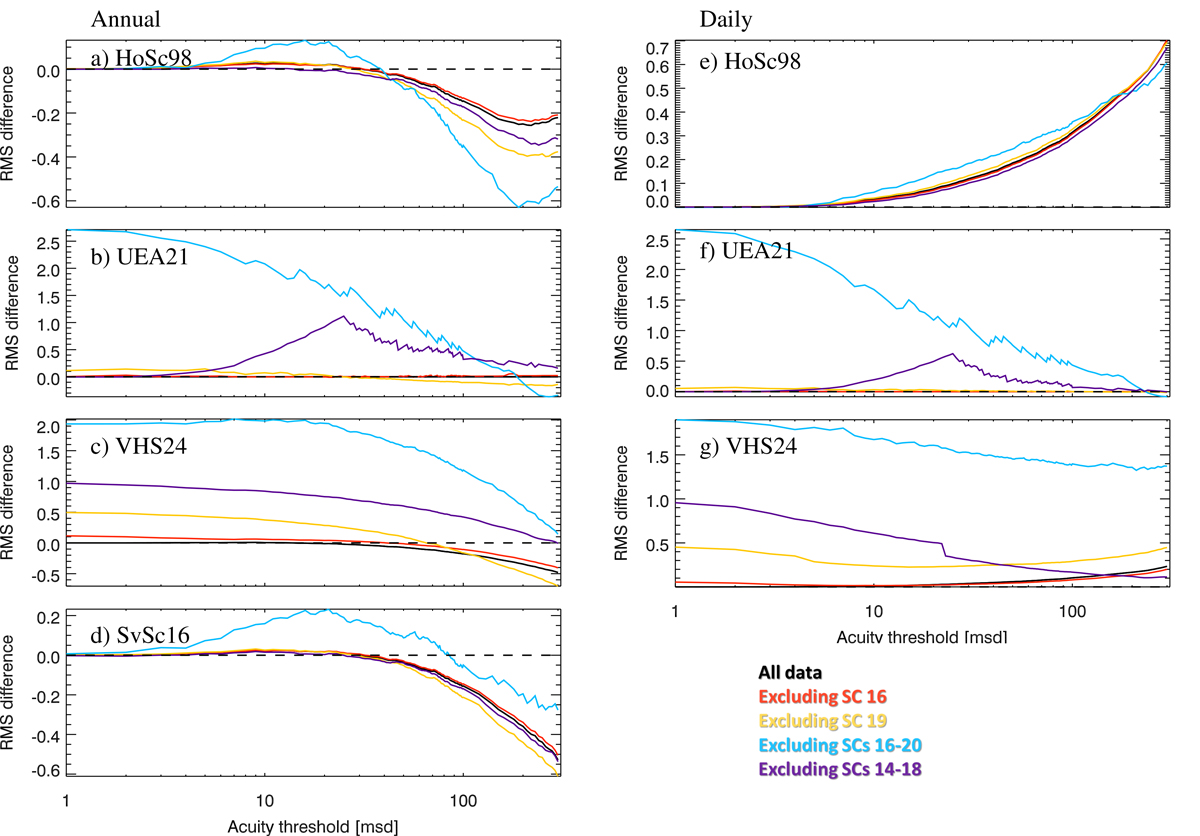
Fig. 8.
Download original image
Comparison of RMS differences returned by the various methods with that of CEA17 by considering different calibration periods. The curves are shown as the RMS difference of each method (as denoted in each panel) minus the RMS difference of CEA17 (positive and negative values mean CEA17 performs better and worse than the respective method, respectively).
Current usage metrics show cumulative count of Article Views (full-text article views including HTML views, PDF and ePub downloads, according to the available data) and Abstracts Views on Vision4Press platform.
Data correspond to usage on the plateform after 2015. The current usage metrics is available 48-96 hours after online publication and is updated daily on week days.
Initial download of the metrics may take a while.