Fig. 4.
Download original image
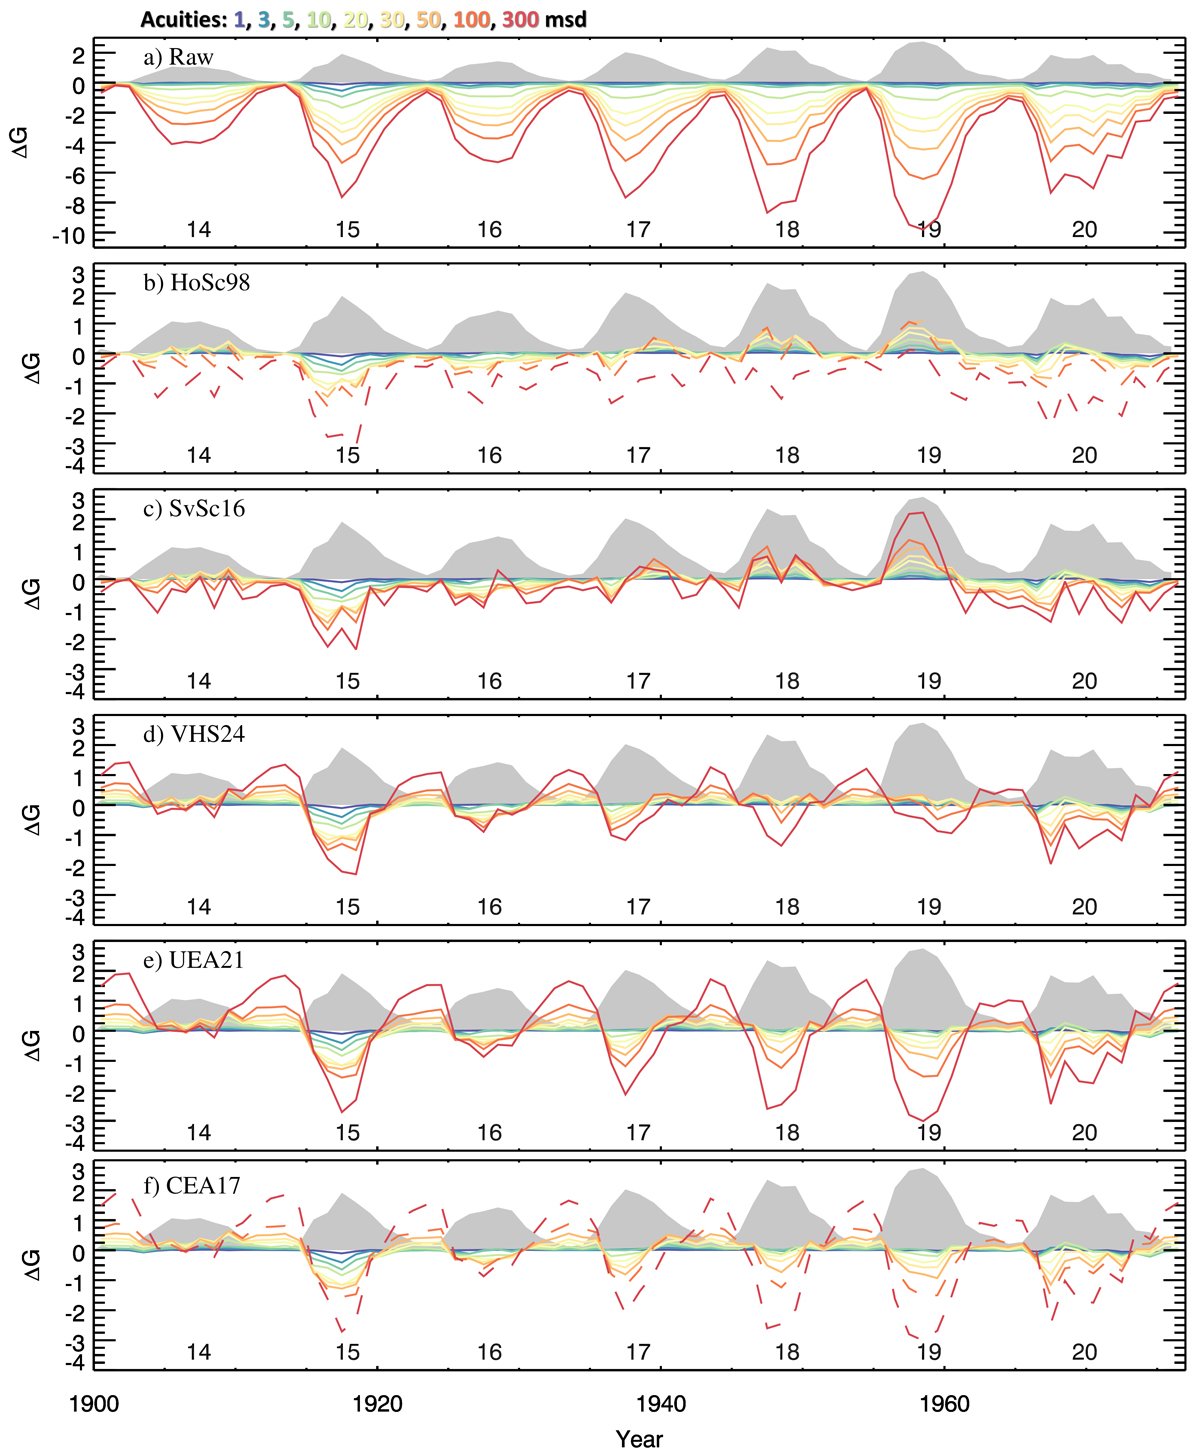
Difference between group counts of synthetic data of different acuity to the original RGO data (![]() ). Shown are the differences for the raw data (panel a), and those calibrated with the various cross-calibration methods (as denoted in each panel), thus positive (negative) values mean the cross-calibration over- (under-)estimates the result. The results for different acuities are colour-coded as denoted at the top of the figure. The dashed lines denote the series that would be excluded from the calibration processes according to the criteria of the method in question. To visualise the phase of the solar cycle, we also show a scaled version of the group counts from RGO, depicted as a shaded grey surface. Shown are the annual mean values. The numbers at the bottom of each panel denote the conventional solar cycle numbering.
). Shown are the differences for the raw data (panel a), and those calibrated with the various cross-calibration methods (as denoted in each panel), thus positive (negative) values mean the cross-calibration over- (under-)estimates the result. The results for different acuities are colour-coded as denoted at the top of the figure. The dashed lines denote the series that would be excluded from the calibration processes according to the criteria of the method in question. To visualise the phase of the solar cycle, we also show a scaled version of the group counts from RGO, depicted as a shaded grey surface. Shown are the annual mean values. The numbers at the bottom of each panel denote the conventional solar cycle numbering.
Current usage metrics show cumulative count of Article Views (full-text article views including HTML views, PDF and ePub downloads, according to the available data) and Abstracts Views on Vision4Press platform.
Data correspond to usage on the plateform after 2015. The current usage metrics is available 48-96 hours after online publication and is updated daily on week days.
Initial download of the metrics may take a while.