Fig. 2.
Download original image
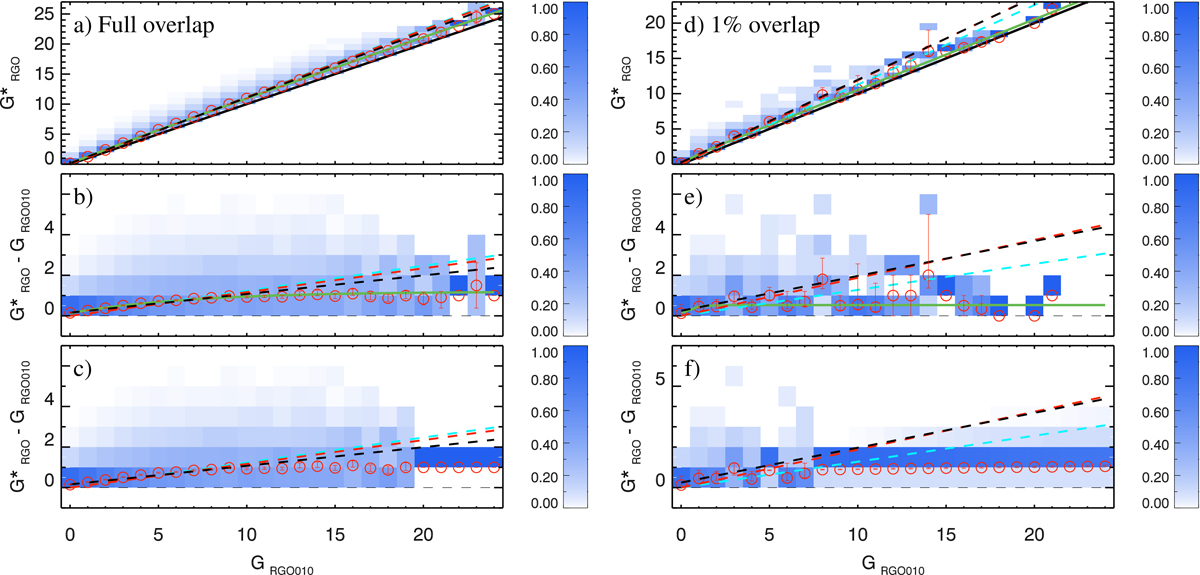
Calibration matrix for the method by Chatzistergos et al. (2017) between RGO and a synthetic observer with acuity threshold A = 10 msd (that is RGO010). The matrices show probability mass functions, which are colour-coded (see colour bars to the right of each panel). The top panels show the matrices with the actual records, while the middle and bottom panels show the matrices for the difference of the counts of the observers. In the bottom panel, the columns of the matrix that had insufficient statistics were filled with a Monte Carlo bootstrap simulation. The left-hand column is for the full period of RGO observations, while in the right-hand column only 1% of the randomly selected days were considered (see Sect. 3.3). The red circles with error bars give the mean values within each column and the 1σ intervals. The green curve shows the fit represented by Eq. (3), while the scalings for HoSc98, SvSc16, and VHS24 are shown in dashed cyan, red, and black, respectively. We recall that SvSc16 was determined for annual values. The solid black line in the top panels denotes a slope of unity.
Current usage metrics show cumulative count of Article Views (full-text article views including HTML views, PDF and ePub downloads, according to the available data) and Abstracts Views on Vision4Press platform.
Data correspond to usage on the plateform after 2015. The current usage metrics is available 48-96 hours after online publication and is updated daily on week days.
Initial download of the metrics may take a while.