Fig. 11.
Download original image
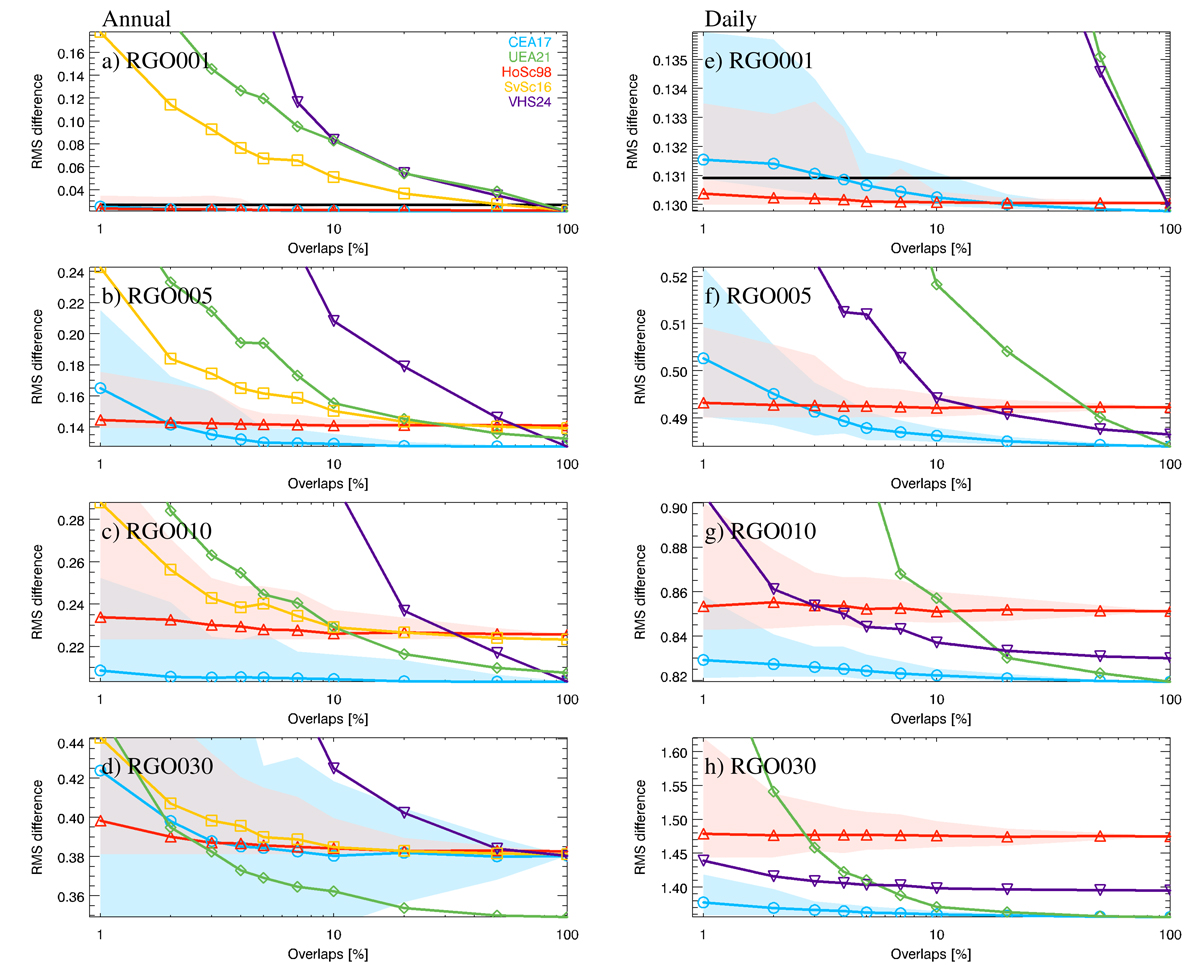
Comparison between the performance of the various cross-calibration methods on synthetic observers as a function of overlap to the original RGO data. Shown are the results for synthetic observers with acuity thresholds of 1 (a, e), 5 (b, f), 10 (c, g), and 30 (d, h) msd. The shaded surfaces mark the range due to the 100 realisations for each case of overlap, but to ease visibility are shown only for CEA17 and HoSc98. The RMS differences are computed for the annual values (left column) and the daily values (right column). The horizontal black line marks the differences if the raw data are used uncalibrated (shown only at the top panels).
Current usage metrics show cumulative count of Article Views (full-text article views including HTML views, PDF and ePub downloads, according to the available data) and Abstracts Views on Vision4Press platform.
Data correspond to usage on the plateform after 2015. The current usage metrics is available 48-96 hours after online publication and is updated daily on week days.
Initial download of the metrics may take a while.