Open Access
Fig. 3
Download original image
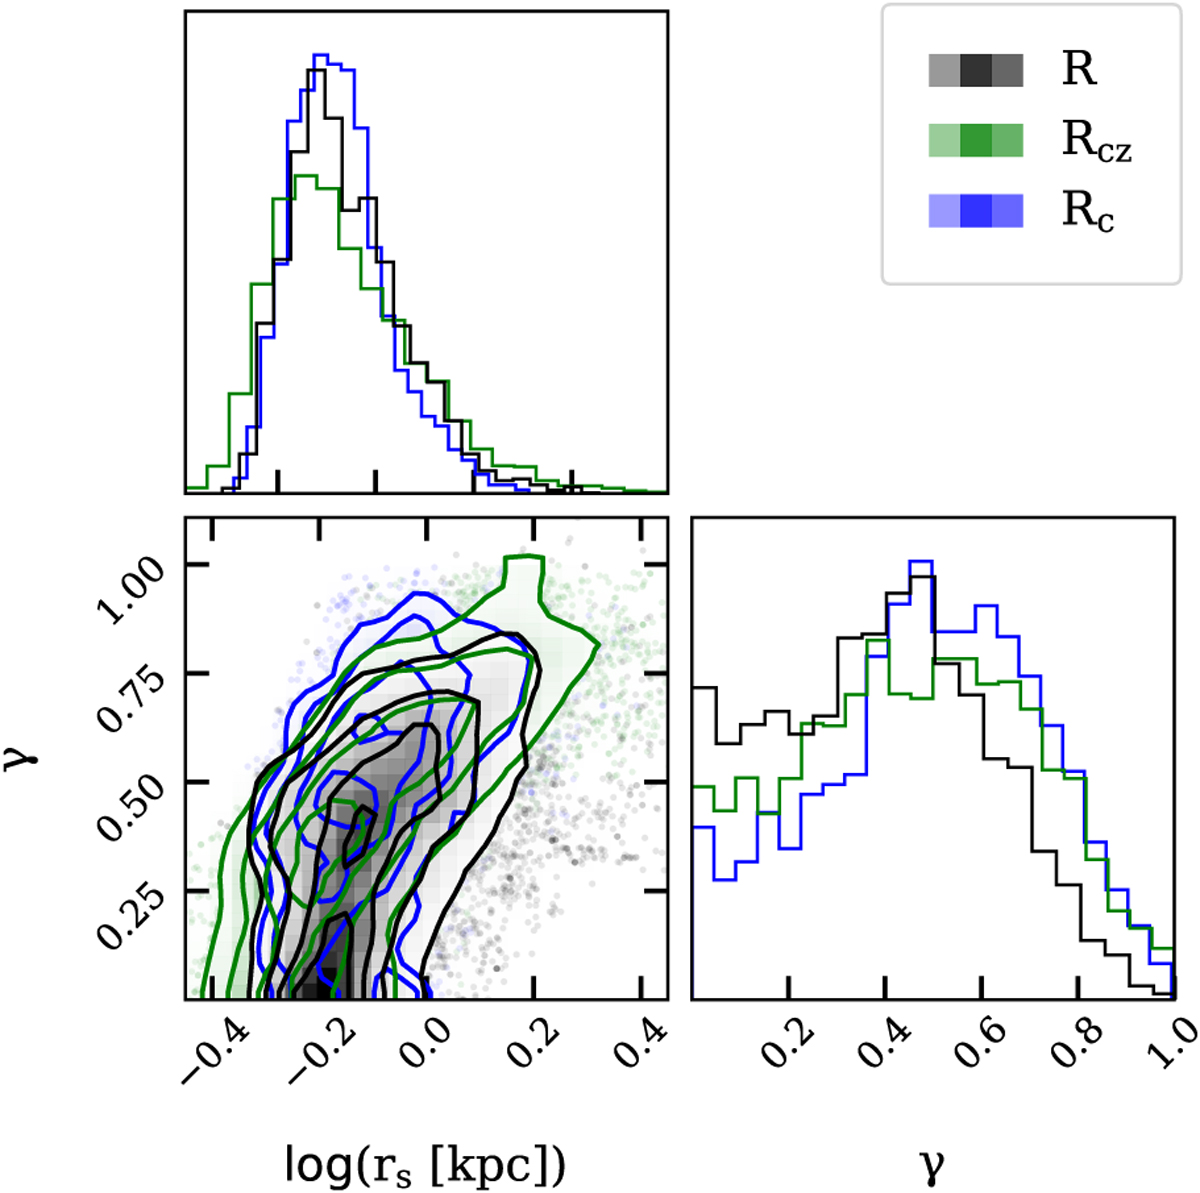
Two-dimensional marginalized posterior distribution of rs and γ and the corresponding one-dimensional posterior distributions. The PPDs are shown when using the semi-major axis radius (black), circularized radius (green), and circular radius (blue), as indicated in the legend.
Current usage metrics show cumulative count of Article Views (full-text article views including HTML views, PDF and ePub downloads, according to the available data) and Abstracts Views on Vision4Press platform.
Data correspond to usage on the plateform after 2015. The current usage metrics is available 48-96 hours after online publication and is updated daily on week days.
Initial download of the metrics may take a while.